Fifteen Years Later: Whither Restructuring in the American Electric Utility System?
A postscript to Power Loss: The Origins of Deregulation and Restructuring in the American Electric Utility System
Technology’s Stories vol. 1, no.1
doi: 10.15763/JOU.TS.2013.12.1.01
PDF: Hirsh_Fifteen Years Later
The process of restructuring the American electric utility system has not been kind to its advocates. Begun about fifteen years ago, the opening of markets and increased competition in the formerly tranquil, monopolistic system had been expected to yield innovative services and lower costs, just as deregulation of other industries had done earlier. Instead, the restructuring process resulted in poorly designed markets in California and elsewhere, scandals involving independent generating and marketing companies, the bankruptcy of a major utility firm, and—worst of all in the minds of many—higher prices for electricity. Even the 2003 blackout that severed power to 50 million northeastern Americans has been blamed, in part, on deregulation. At least one legislator publicly apologized for his advocacy of restructuring, claiming he had been “hoodwinked” by his state’s major utility.[1] Others have busily tried to help their constituents recover from the worst consequences of deregulation.[2]
This essay describes events occurring since restructuring gained a legal footing in California in the late 1990s. It advances the thesis of my book, Power Loss, namely that the traditional holders of political and economic control—power company managers—have lost significant clout as the century-old “utility consensus” continues to dissolve. While one can argue that those corporate executives have regained some influence, especially in states that restored regulation, much of the flux that characterized the utility system in the late 1990s persists today. That instability remains because utility managers still must contend with increasingly powerful federal regulators, environmental advocates, public benefit fund officials, and supporters of potentially disruptive technologies. At the same time, people of various political stripes have become disillusioned with government’s ability to regulate markets and with free enterprise to pursue activities that benefit society, making any type of further restructuring unpopular. Consequently, the creation of a new consensus in the American utility system remains unlikely in the near future.
Of Consensus, Momentum, Stasis, and Deregulation
The utility consensus describes the coalescence of interests forged in the early 1900s among various stakeholders in the electric utility system. As noted in Power Loss, business managers, politicians, investors, engineers, educators, and customers realized that they would benefit from creation of state-regulated, natural monopoly utility companies. These firms could exploit increasingly sophisticated and large-scale technology in a way that competitive businesses could not, allowing them to provide a growing amount of electricity to more customers at lower unit costs. As electricity consumption surged, through the use of new appliances in the home and power-hungry motors in factories, the material standard of living improved, and industrial productivity escalated.[3]
Using the systems language of social scientist Thomas Hughes, the electric utility system through much of the twentieth century acquired enormous “momentum”, a “mass of technological, organizational and attitudinal components [that tend] to maintain their steady growth and direction.”[4] The system’s tendency to sustain a given path stems from the actions of the stakeholders, their investments, and the culture of the people working within the system. Together, these elements promoted continuation of business as usual and the appearance of a large degree of momentum.[5] Moreover, the momentum helped maintain the power relationships of most of the stakeholders, with utility managers in particular holding control over many of the business, regulatory, and political elements of the system.
The continued success of the electric utility system—in all its technical and human dimensions—seemed well established and, like other elements of the nation’s energy system, it appeared to have no end in sight. Yet the electric utility system began to lose its momentum in the late 1960s and 1970s. The first challenge expressed itself in the technological realm. In great detail elsewhere,[6] I have demonstrated that the traditional technologies used to generate electricity—the technologies largely responsible for boosting productivity and reducing the cost of electricity—stopped improving. I call this phenomenon “technological stasis,” which had its roots in hardware problems and (as importantly) in the behavior of utility executives, engineers, and manufacturers.
Stasis meant that utilities no longer had a way to drive down the cost of power production or to mitigate effects of inflation or other causes of higher costs. And just as stasis struck, so did increased costs, especially for fuel. Striking in 1973, the energy crisis caused the cost of all fuel resources to increase dramatically. As the cost of oil and coal for the generation of power increased, utilities needed to boost prices—a dramatic reversal of decades of practice. Responding to higher electricity bills, customers cut back on usage, producing a few years (1974 and 1982) of negative growth rates of consumption, followed by years of growth at a tepid annual rate of about 2 percent from 1973 to 2012.[7]
The change in momentum on the technological front had ramifications for the utility consensus. Many state utility regulators, who had previously supported power companies’ activities, became more assertive of customers’ concerns during the 1970s and required increased efforts at energy efficiency. The actions contrasted to the easy approvals previously given to utilities to build new power plants. In a similar vein, Congress passed a set of laws in 1978 that required energy firms to alter their behavior. One piece of legislation, the Public Utility Regulatory Policies Act (PURPA), encouraged increased overall energy efficiency by providing incentives to nonutility companies that produced power using cogeneration and renewable energy technologies. Inadvertently, the law also spurred efforts to deregulate the utility system because nonutility generators of power could often produce electricity at costs comparable to those offered by utilities; by doing so, the independent electricity producers appeared to challenge the rationale that legitimated natural monopoly status of regulated utilities. Pursuing this logic further, the 1992 Energy Policy Act, advocated by President George H.W. Bush after the first Iraqi War, enabled individual states to deregulate their electric power systems more fully, with the hope that free-market competition would enable innovation and make electricity production more efficient and less costly. As states began the deregulation process, with California being the first large state to pass a restructuring law in 1996 (to be implemented starting in 1998), it appeared that the existing utility consensus had dissipated, and momentum had clearly been altered.
Initial Exuberance Tempered by the California Electricity Crisis
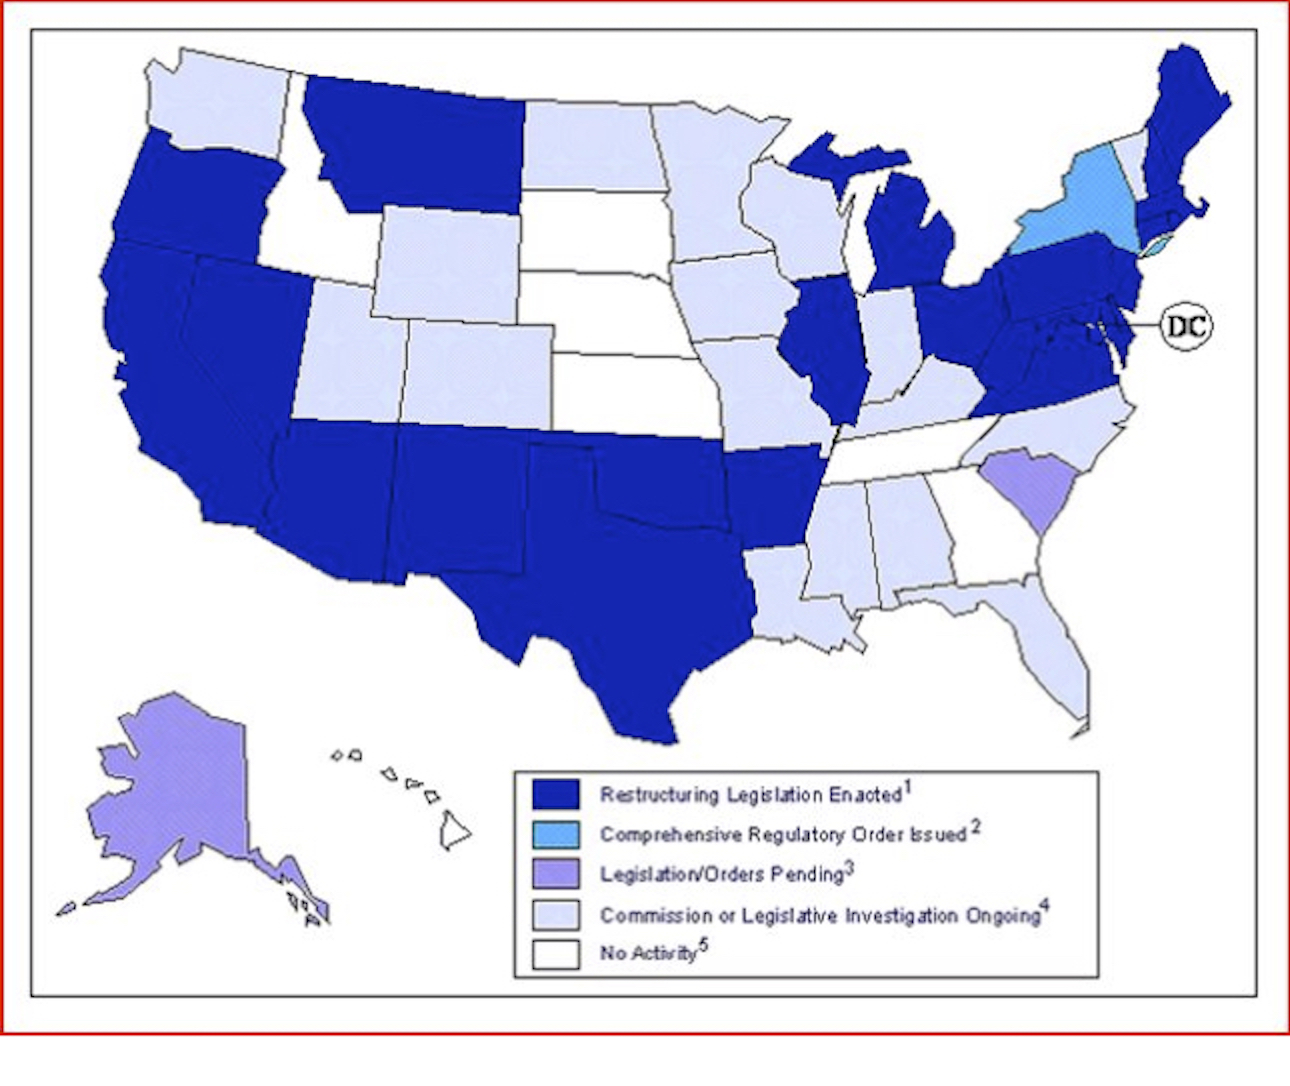
Evidence of the changed momentum appeared in the form of state initiatives to deregulate their power systems. By October 2000, 23 states (and the District of Columbia) had passed laws that enabled customers to shop for power from traditional generators and from those that offered “green” power and energy-efficiency services. In New York, the Public Service Commission effectively created a competitive framework, and in all but five states, some form of restructuring activity had begun. (Figure 1.)
The Golden State’s initial experiences provided encouragement for the optimistic pursuit of restructuring. After a three-month delay caused by computer problems with the Independent System Operator (ISO) and the Power Exchange, institutions created by the restructuring legislation to manage an orderly wholesale market, California’s $23 billion electricity business opened for competition on 31 March 1998.[1] More than two hundred independent companies registered to resell electricity to residential and business consumers, and a 10% rate reduction had already been implemented for customers of traditional utilities.[2] Nineteen participants (including the state’s three major utilities) bid for electricity on the first day, with the average wholesale price settling just below $20 per megawatt-hour (MWh). That price compared to about $24 per MWh in the days before deregulation.[3]
For two years, retail competition appeared successful. Some businesses obtained favorable long-term contract prices for power, and residential consumers benefited from mandated rate reductions or discounts from new marketers. Many customers even chose to pay premium prices to alternative energy companies, such as Green Mountain Energy Resources, which offered electricity produced from wind and water turbines.[4] In other words, restructuring seemed to offer customers lower prices and new options, exactly as its advocates promised.
As part of the deregulation process, formerly monopolistic utilities needed to sell generation assets to independent companies. After all, how could competition work without competitors? With the money obtained from these asset sales, power companies paid off debts incurred from building some plants and from committing to long-term power contracts with nonutility companies that enjoyed favored status under PURPA. According to California’s 1996 restructuring law, retail rates would remain frozen until these debts had been paid off, or at the end of March 2002, whichever came first. In an unexpected development, independent power companies bid up prices of several generating plants divested by southern California utilities. Consequently, on July 1, 1999, San Diego Gas and Electric officially ended its rate freeze, and its customers became subject to a free market of power. For months, little changed, as electricity prices remained tame.[5]
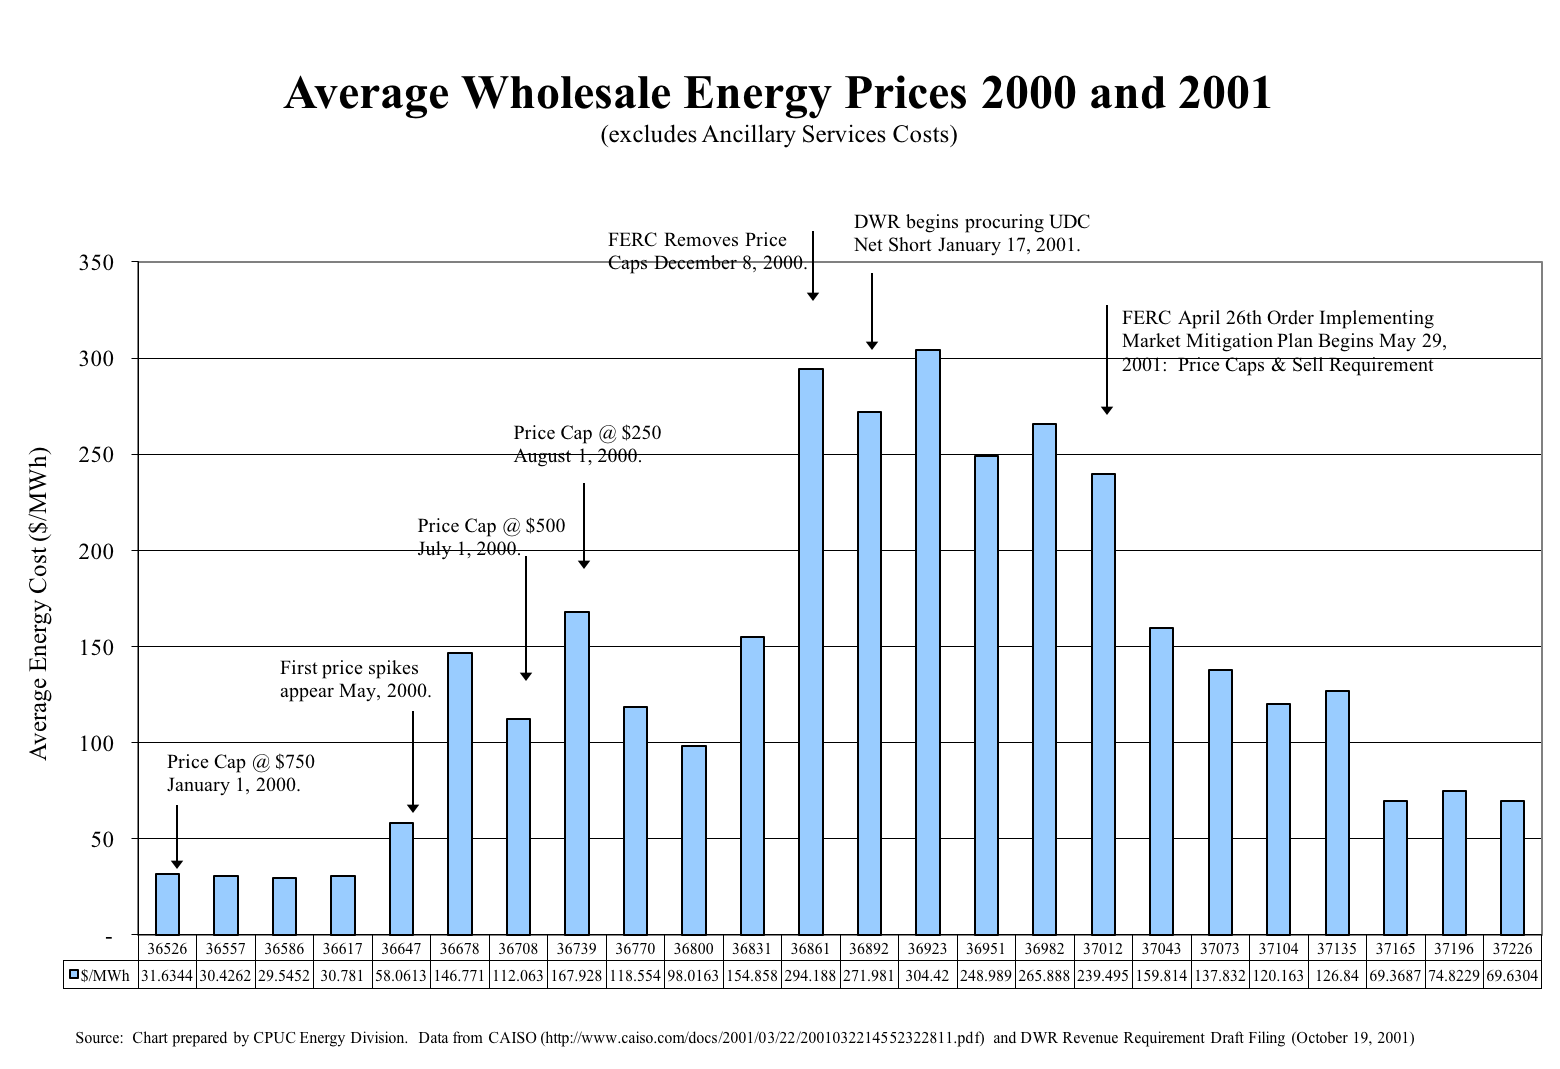
Then, in May 2000, prices began rising on the wholesale market, reaching more than 50 cents per kWh. To customers of Pacific Gas and Electric and Southern California Edison, still protected by the rate freeze, the higher wholesale prices had little practical impact. They still paid around 10 cents per kWh even if their suppliers paid much more. But San Diego customers felt the brunt immediately, and they protested bitterly about what seemed exorbitant and unjustified rates.[6] Taking heed of the complaints, the Independent System Operator imposed price caps, limiting payments to generators of power. Set at between $250 and $750 per MWh (25 to 75 cents per kWh), the caps still allowed for much higher rates than in the first two years of restructuring. At the same time, managers of generating companies, upset at the profit-restraining caps, often sold power out of the state, where they could secure better market prices.[7]
As California’s power supply diminished, the wholesale price of electricity in several western states rose to as high as $1,400 per MWh, about seventy times the price seen when deregulation began.[8] By December 2000, the Federal Energy Regulatory Commission (FERC) intervened and removed price caps altogether as a way to reestablish power sales to the Golden State. The average wholesale price peaked at more than $300 per MWh in February 2001 before moderating. (Figure 2.)
Utility companies found themselves in a bind. Having sold many of their generating facilities as part of the restructuring plan, they had become middlemen who bought power on the wholesale market and distributed it to customers. But the rate freeze for Pacific Gas and Electric and Southern California Edison customers meant that utilities could not charge more than about 6 cents per kWh for the generation component of electricity despite paying 30 cents or more per kWh! Even the giant Pacific Gas and Electric Company could not ride out the storm, declaring bankruptcy in April 2001.[10] Southern California Edison closely approached insolvency too.[11] Meanwhile, independent electricity firms appeared to profit handsomely. Reliant Energy reported a 600% increase in earnings during the third quarter of 2000, with California sales accounting for approximately $100 million of its $276 million gains.[12]
Along with the utilities, customers suffered through the spring of 2001. Because of inadequate supplies of power, the Independent System Operator declared 38 stage-3 emergencies (defined as when electricity reserves slumped below 1.5%), triggering “rolling” blackouts of 60-90 minutes to ration electricity in the first six months of 2001. For comparison, during all of 2000, only one such emergency had been issued.[13]
As the crisis evolved, state politicians tried to mitigate it. Governor Gray Davis, a Democrat with reported presidential aspirations, at first sought to resolve the supply inadequacies without raising customers’ rates.[14] But after several months, the governor, who inherited the restructuring plan from his Republican predecessor, intervened more forcefully. Declaring a state of emergency on 17 January 2001, the governor authorized the California Department of Water Resources (DWR) to purchase power for utilities. The step appeared necessary, since nonutility power suppliers preferred not to sell directly to utilities, which had become bad credit risks. As another effort to guarantee enough power for the state’s citizens , the state legislature encouraged the DWR to enter into long-term, stable contracts with electricity suppliers. To pay for these agreements, the California Public Utilities Commission (CPUC) approved higher electricity rates—effectively ending the price freeze that was supposed to last another year. And to help stabilize the chaotic market, the legislature empowered the CPUC to end customers’ right to shop for the best price of power, which it did in September 2001, effectively terminating California’s market experiment.[15]
What caused California’s “electricity crisis” of 2001? Analysts have highlighted several flaws in the restructuring legislation, such as utility companies’ proscription from signing long-term contracts at fixed prices (for periods of months or years) from electricity suppliers. Rather, utilities bought power in the market run by the Power Exchange, in which prices changed hourly and daily, and in the real-time “spot” market managed by the ISO, in which prices changed more frequently.[16] By prohibiting prolonged agreements, the law’s authors hoped that utilities could benefit from falling prices resulting from the expected emergence of new competitors. For two years, the arrangement worked well.[17]
But by spring 2000, power supplies dwindled even as demand for power rose (due in part to a vibrant California economy). Simple economic principles dictated that prices would rise—unless, of course, the supply of power increased as well. To be sure, some independent power companies built new generating plants, hoping to sell electricity into the wholesale market. But many power generators removed their facilities from the grid at a time when power prices headed up. According to generating companies, such as Duke Power, Mirant, Calpine, and Dynergy, some of the plants simply had to be removed from service for normal maintenance.[18] Others left the market because they had exceeded pollution limits for the year.[19]
Critics of the firms’ behavior contend that the companies’ managers restricted supply to inflate wholesale power prices.[20] The generators could then reenter the market and earn handsome profits when they resumed selling electricity. Revelations coming from recorded communications between employees of independent generating and marketing companies appear to substantiate these contentions, especially those relating to Enron, the high-flying natural gas and energy trading firm.[21] Using deceptive bookkeeping and rapid trading techniques, Enron exploited a “fatally flawed market design” (in the words of a 2003 FERC analysis).[22] The firm also maintained a culture that encouraged reckless risk taking that put corporate profits ahead of public welfare. Succumbing to bankruptcy in late 2001, Enron received a large share of the blame for the California crisis, at least in the public’s eye.[23]
Beyond these problems dealing with the structure and manipulation of the electricity market lurked the increased cost of natural gas, the favorite low-polluting fuel that powered several generating plants. Nationally, the price of this premium fuel soared three-fold in 2001, resulting from increased demand during an especially cold winter of 2000 to 2001, and disruption of pipeline supplies.[24] The previously low price for natural gas had discouraged exploration for the fuel, thus setting the stage for a typical boom and bust cycle. With little new gas discovered, existing supply became more costly. In California, the price to industrial customers rose by a factor of 4.5 from September 1999 to April 2001.[25] Naturally, the cost of electricity rose as well.
As the importer of about 20% of its electricity, California also felt the impact of higher electricity prices elsewhere. In particular, the state bought power from Oregon and Washington, which generated power largely from hydroelectric dams. But these states encountered their own problems, resulting from lower-than-normal precipitation levels, leaving reservoirs depleted.[26] In these states, the cost of power started rising before Californian demand ratcheted up prices even more.[27]
The cap on consumers’ prices further exacerbated problems. Part of the political compromise that won unanimous support in both houses of the California legislature, the cap provided price stability to residential consumers for several years as the state moved toward a competitive market. But by insulating customers from the fluctuating price of electricity in the wholesale market, the cap gave improper economic signals on how to use power. If electricity production became more expensive for whatever reason, the increased costs would not be passed on to consumers. Customers therefore did not know that they should pursue energy-efficiency measures, remaining happily blissful to the problems faced by the companies delivering electricity to them. Consequently, power demand kept increasing—though not heavily—at a time when supply had fallen dramatically.[28]
Many analysts expected the summer of 2001 to aggravate an already perilous electricity crisis. As Californians turned on their air conditioners, demand would peak, as it always did during the warm months. But the blackouts and high cost for wholesale power did not recur, partly because of aggressive energy-efficiency efforts. With emergency legislation authorizing rebates for purchases of high-efficiency appliances and with new conservation programs rolled out by the California Energy Commission and utilities, demand for power subsided considerably. In May 2001, users reduced peak demand by more than 10% over the same period in the prior year. During the next month, peak demand sank to 14% below that of the previous June. For all of 2001, consumers shaved peak demand by almost 9% while cutting consumption by almost 7%.[29] Unhappily for supporters of deregulation and restructuring, who argued that competitive forces alone would work effectively, these dramatic improvements occurred due to forceful state intervention in a poorly functioning market.
Taking more pressure off the power market, the DWR signed long-term contracts with electricity generators, an approach not permitted under the original restructuring legislation. Consequently, the number of short-term contracts traded on the wholesale market declined substantially. According to some analysts, the situation in which companies could remove power from the grid and manipulate the short-term market no longer existed, and the firms resumed production. With more power coming into the market and with less demand for it on the spot market, prices dropped.[30] By early 2002, wholesale prices had fallen to between $30 and $35 per MWh. In fact, the price dropped so much that the state sought to renegotiate $43 billion in long-term contracts that had locked in prices of about $70 per MWh—a price that seemed quite attractive when negotiated during the height of the crisis.[31]
The California experience soured many people on the value of deregulation. Instead of price reductions resulting from restructuring, the Golden State’s businesses and residents saw price hikes. And rather than watching the free market encourage scores of competitors to offer new products and services, the state eliminated customer choice and empowered a government agency to buy power for utilities. Meanwhile, as news about market manipulation became public, observers and policy makers worried that malicious companies might exploit free markets in other states.[32] Some observers noted that the California experience should not necessarily discourage other entities from restructuring elsewhere, arguing that market reform still had much value when done correctly.[33] Nevertheless, with the California crisis and the Enron scandal prominent on their minds, policy makers in seven states lost their ardor for restructuring and put plans on hold.[34] (Figure 3.)
Other States’ Experiences
Even with this backpedaling, not all states that pursued deregulation of power markets suffered like the Golden State. Pennsylvania, for example, appeared at first to do correctly what the western state did poorly. Though it passed a restructuring law only a few months after California did (in December 1996), Pennsylvania did not require utilities to divest generating assets. Consequently, utilities could draw on power they produced rather than remain totally dependent on the wholesale market, in which prices could fluctuate wildly. Moreover, the legislation allowed utilities to arrange long-term contracts for wholesale power. They could therefore lock in prices for years ahead, hedging against high prices on the spot market. Just as important, Pennsylvania began competition in 1999 with a surplus of generation supply that enabled it to export power. Moreover, Pennsylvania’s utilities participated in the PJM Interconnection, a long-tested and reliable regional transmission organization that ties the state’s grid to those of New Jersey, Maryland, Delaware, Virginia, and other states.
Partly because of these differences, the Keystone State’s governor crowed about the success of competition at the same time that the California crisis brought national attention to restructuring. In an address in March 2001, Governor Tom Ridge observed that more than one million Pennsylvanians had shopped for power, with savings accruing to $3 billion. Additionally, while Pennsylvania’s electricity rates had stood 15% higher than the national average before restructuring, by 2001, they had dropped to below average. And in great contrast to the California experience, noted Ridge, the power kept flowing steadily and without unusual interruption.[36]
This rosy picture did not last forever. Within a year of the governor’s speech, many Pennsylvanians had begun to question the worth of restructuring. Because the state’s utilities retained so much of the generation supply (82%), they could control prices too easily, observers noted. And in January 2001, when the utilities raised the price they charged for the reserve (or backup) power that the PJM system required all generating companies to own or buy, wholesale prices escalated. Soon, customers could not find better deals for power than what utilities offered. About 44% of customers who had chosen alternative suppliers reverted to their previous utility companies, and 26 of the 96 new competitive electricity suppliers departed the market.[37] Participation in the state’s retail choice program continued to decline—from 11 percent of residential sales made within the competitive framework in 2001, to 2 percent in 2009.[38] (Figure 4.)
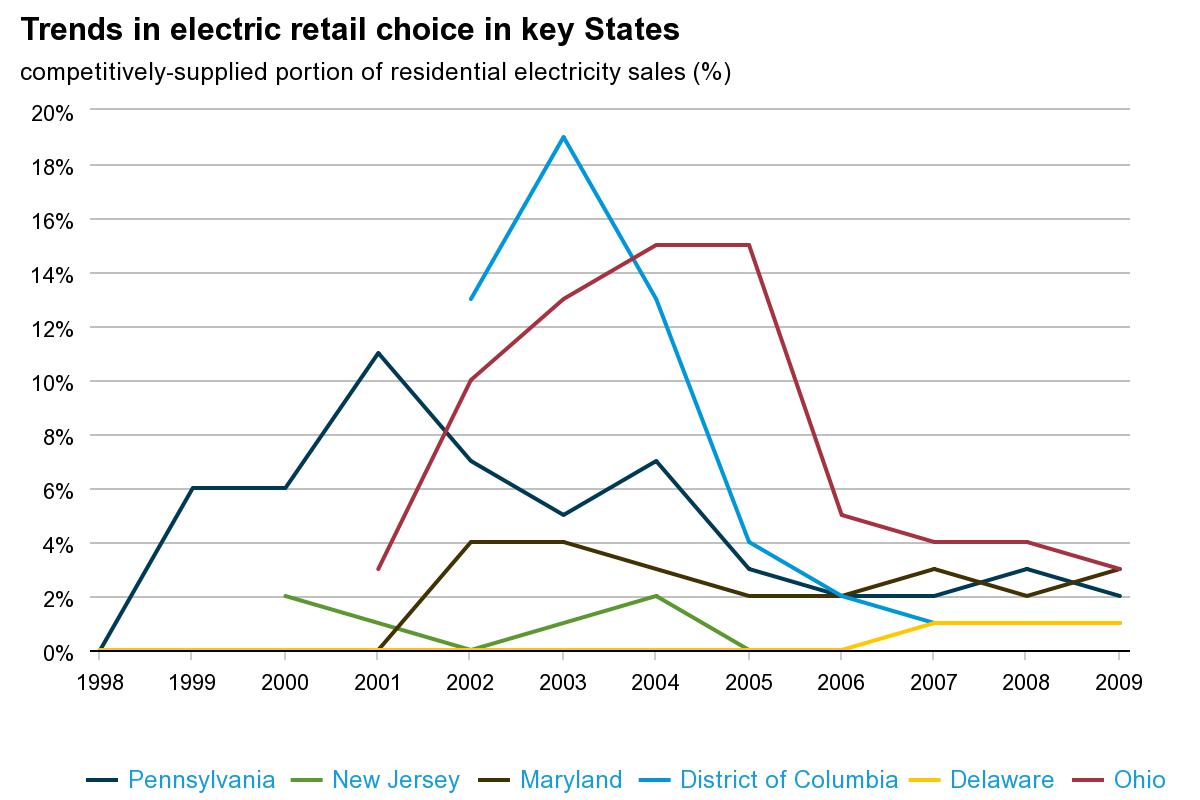
Figure 4. Rise and fall in retail market participation in Pennsylvania (and elsewhere)[39]
Similar discussions occurred in Texas, which enacted a retail deregulation law in 1999. The legislation required investor-owned utilities to separate their wholesale generation, transmission and distribution, and retail activities to become competitive with other providers, but the companies could retain ownership of all three sectors through holding companies.[40] Exceptions existed for some municipal utilities and cooperatives, so that by May 2007, more than 5 million customers in the state could shop for retail power. About 39 percent chose to switch, with large customers taking greatest advantage of the competitive market.[41] (By law, residential customers needed to choose a supplier or have one assigned, thus pushing participation to 60% of all residential sales from 2002 through 2009.[42]) And while the outcome of Texas’ retail deregulation effort remains contested, many people view the experiment as a success.[43] Members of the Public Utility Commission of Texas, for example, observed in January 2009 that the competitive market enabled the state to become a world leader in wind energy production, at the same time that it offered a host of related services, including energy-efficiency.[44]
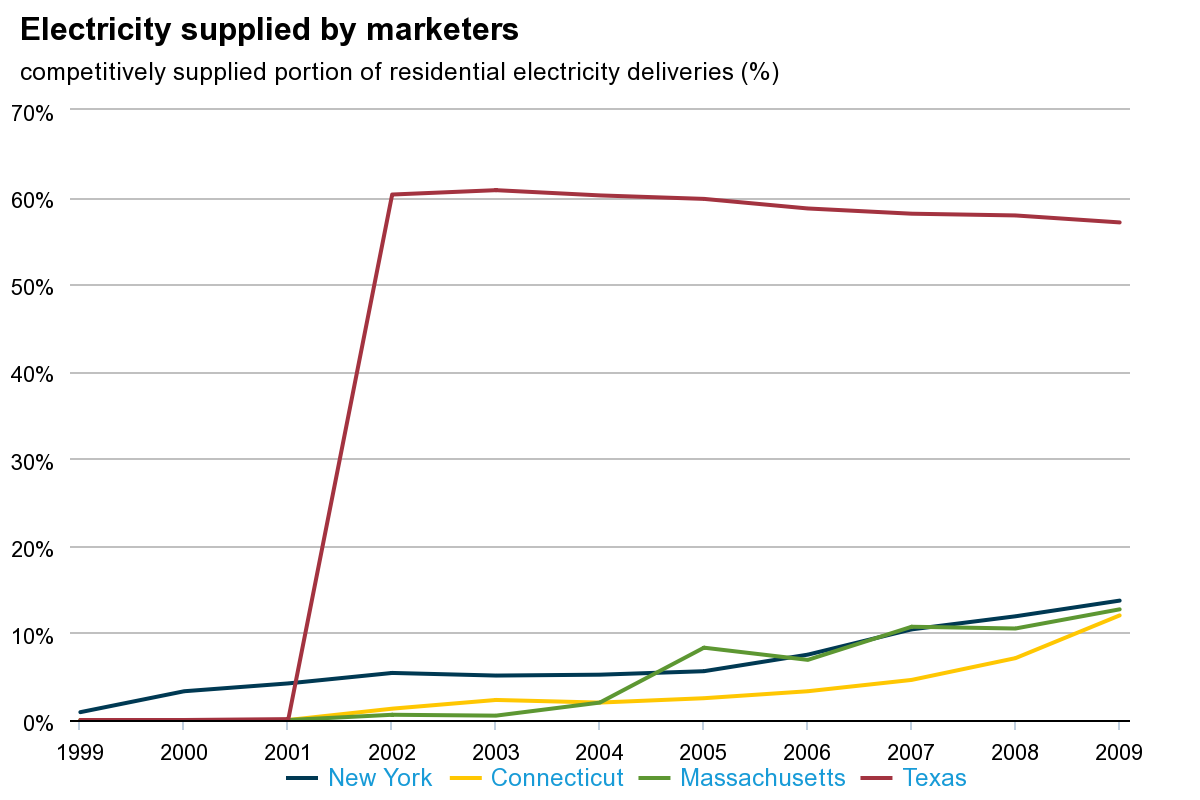
Figure 5. Surge in participation in Texas competitive market[45]
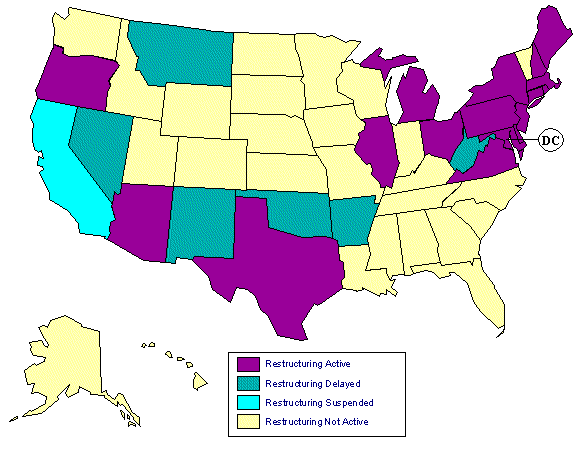
The success—debatable as it remains—of restructuring in Pennsylvania and Texas did not impress everyone. As rate caps began expiring in states that continued restructuring, prices often skyrocketed, affected by higher natural gas costs and a tight power supply market. In Illinois, the freeze ended in January 2007, and rates exploded 26% and 55% for customers of two of the state’s utilities. Customers in Maryland and Massachusetts experienced similar rate shocks.[46] Some state governments took action to limit these increases; in Virginia, the General Assembly in 2007 restored a form of regulation and ended its experiment with retail free-market electricity.[47] In 2009, Maryland’s governor called for a similar measure.[48] By January 2010, the Department of Energy’s restructuring map appeared considerably different than it did during the heady days of 2000. It included numerous states in which the DOE listed restructuring activity as “not active,” while another eight states suspended deregulation efforts altogether. (Figure 6.)
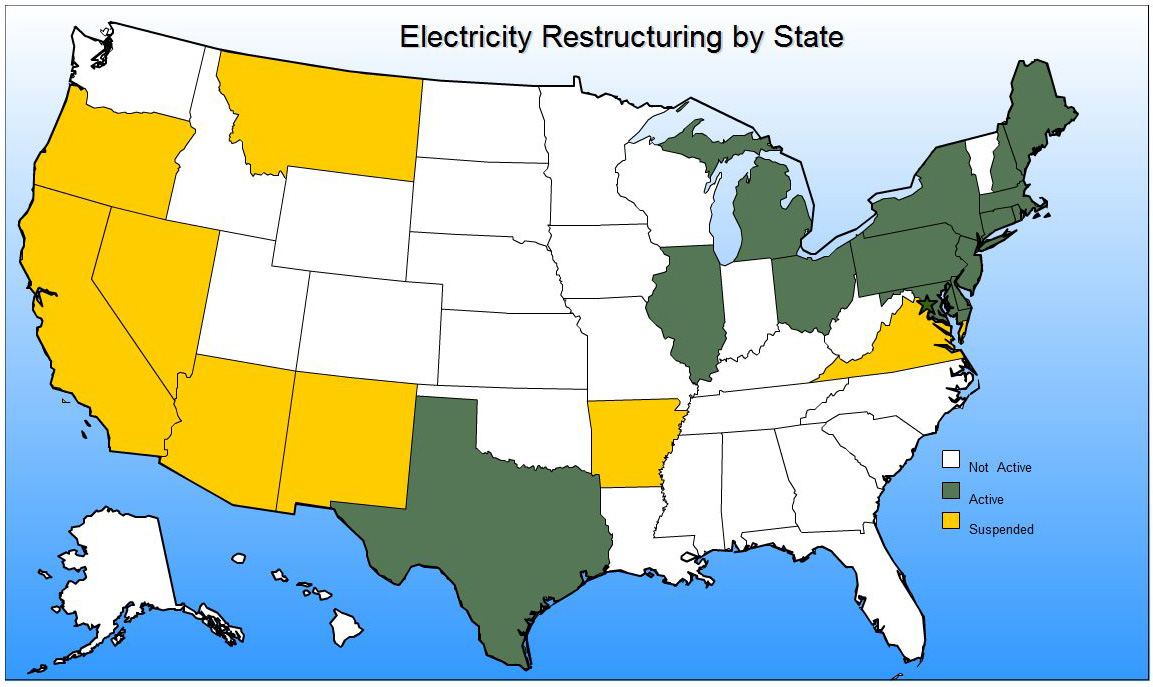
Figure 6: Restructuring Status as of January 2010[49]
The 2003 Blackout and the Growing Power of FERC
The widespread power failure that affected more than 50 million people on 14 August 2003 highlighted additional flaws in the restructuring process, most notably the disincentives for investment in the transmission system. It also focused attention on the fragility of a transmission infrastructure that could not handle more intensive use than it had been designed for. The Federal Energy Regulatory Commission entered the fray to help resolve the problems and gained new authority in the process.
The largest blackout in the nation’s history began when a transmission line in Ohio’s FirstEnergy Corporation service area sagged in the summer heat and made contact with overgrown trees.[50] The event triggered a cascading set of human, computer, and institutional failures that diverted power to overloaded transmission wires and shut down 102 power plants (including 22 nuclear plants). Ultimately, electricity service terminated in eight northeastern states and two Canadian provinces. An investigation conducted by American and Canadian government bodies emphasized the inadequate responses by managers of FirstEnergy as well as poor understanding of the entire system by reliability coordinators working for the Midwest Independent System Operator. [51]
While focusing on the technical causes of the blackout, the governments’ report did not explicitly investigate the role of restructuring as a causal element. The document’s authors left that concern for a later investigation, one that apparently never occurred. Nevertheless, several observers unaffiliated with the report suggested that restructuring may have contributed to the blackout. They argued, for example, that since the prospect of deregulation appeared ominous in the 1990s, utility companies reduced spending on improvements and regular maintenance of transmission lines.[52] Unlike generation plants, which could sell power in the competitive marketplace and potentially earn unlimited profits, investment in transmission lines returned profits that remained regulated by the Federal Energy Regulatory Commission. Moreover, building new avenues for power transportation potentially helped competitors enter what had been designed as a noncompetitive system of natural monopolies. Finally, consumers fought against new transmission lines near their homes, partly because of “not-in-my-backyard” concerns and because they feared that high-voltage transmission of power caused an array of illnesses.[53] Consequently, inadequate construction followed.[54]
The blackout handed FERC considerably greater influence, at first by enabling it to order improvement of the decaying transmission network, especially as it became known that utilities had failed to heed prior warnings of potential problems. As early as 1997, the North American Electric Reliability Council (NERC) recognized problems with voluntary compliance of reliability standards in an age of restructuring. In a prescient report, members of the body’s Electric Reliability Panel called for creation of a new organization, sanctioned by the federal government, to enforce reliability standards in wholesale markets.[55] Though winning supporters in the Department of Energy and in Congress,[56] the proposal gained little traction until after the 2003 blackout focused attention on utilities (especially FirstEnergy) that failed to adhere to suggested NERC guidelines.[57] As a result, the blackout report recommended that the federal government mandate reliability standards and penalties for noncompliance.[58] Jolted into action, Congress authorized FERC to create an energy reliability organization (ERO).[59] In July 2006, NERC won approval to become that organization, and FERC later approved 83 reliability standards that the ERO could legally enforce, ending the era of voluntary observance of rules.[60]
Congress also addressed other problems—in particular, the siting and construction of new transmission lines. A provision of the 2005 Energy Policy Act, for example, required the Department of Energy to identify “national interest electric transmission corridors” where equipment should be upgraded or installed to relieve congestion and increase reliability.[61] Providing extraordinary authority, the legislation empowered FERC to permit the installation of transmission lines within these DOE-designated corridors, with special power to do so even if state regulatory authorities did not approve.
The granting of new powers to FERC for transmission siting reinforces the notion that restructuring did not necessarily reduce the role of government. In this case, a federal agency gained increasing authority, especially in acquiring responsibilities for actions that had been pursued by state regulatory bodies. Previously, regulatory commissions employed rules created by their states’ legislatures to decide where transmission lines could be built. The 2005 Energy Policy Act shifted that power to FERC, especially for transmission corridors that crossed state boundaries.[62] The law augmented FERC’s power by granting financial incentives to companies for constructing transmission facilities.[63]
Not everyone appreciated FERC’s acquisition of influence. Opposition emerged from elected officials, public utility commissions, environmental groups, landowners, and others. Citing “the specter of federal preemption of transmission siting decisions,” Virginia’s Governor Timothy Kaine and Attorney General Robert McDonnell in 2007 contested a plan to create a mid-Atlantic transmission corridor through their state. They argued that FERC had inadequately consulted with Virginia authorities while also noting that the designation of the corridor improperly favored transmission approaches to alternatives for solving power congestion problems.[64] Likewise, Pennsylvania Public Utility Commissioner Tyrone Christy worried that FERC’s new power offers “unbounded authority in the hands of the federal government and takes away the rights of states to make choices that will be in the best interest of their citizens…”[65]
Beyond its increased power over the transmission grid’s expansion, FERC accrued influence by ordering greater access to the network by a myriad of players. While the 1992 Energy Policy Act envisioned nonutility generators selling power throughout the grid, technical and legal problems inhibited the immediate use of the transmission network as a common carrier. Most of the network still depended on 1950s-style analog technologies for monitoring and directing power flows in relatively simple, bilateral transactions between utilities.[66] But wholesale competition brought with it immensely complicated transactions that required sophisticated computerized networking equipment to control the flow of electricity (and dollars) between new market participants.[67] At first, utilities that owned transmission networks resisted others who wanted to use “their” lines. To deal with such reluctance, FERC issued its landmark Order 888 in 1996 (with clarifications and expansions through 2006) for “promoting wholesale competition through open access non-discriminatory transmission services by public utilities.”[68] In an effort to encourage construction of new transmission lines, the agency in 2005 began outlining policies to remove barriers to the operation of “independent transmission companies.” These nonutility firms, such as ITC Holding and Trans-Elect Development Company, owned and invested in transmission lines and could transport newly produced electricity from conventional and renewable generation sources.[69]
Perhaps more radically, FERC began opening the wholesale market to another set of players who supplied “demand response,” or the curtailment of power use during periods of high demand or in emergencies. To some extent, demand response simply constitutes a new version of demand-side management, the approach that cuts electricity consumption of specific appliances (such as air conditioners) to reduce peak demand. In 2008, however, FERC encouraged the use of demand response with its Order 719, which formally stated that the technique should be treated as the equivalent of demand supply on the wholesale market.[70] Consequently, large power consumers could enter the market and offer reductions in consumption at strategic times and earn market rates. Small consumers would not necessarily lose out; companies such as EnergyConnect and EnerNOC began serving as aggregators of homeowners and businesses that voluntarily limited consumption (through the use of advanced meters and controllers) in return for payments.[71] FERC’s Chairman Jon Wellinghoff—a strong supporter of energy-efficiency initiatives since his days as consumer advocate in Nevada—appreciated demand response’s ability to lessen dependence on power plants at peak periods. He also felt it could reduce costs and emissions, boost reliability, and better integrate variable renewable resources (such as wind and solar power plants) into the grid.[72]
Environmental Concerns and Public Benefit Funds
FERC took on new responsibilities and pursued new initiatives, but it did not have authority to set overall energy policy, especially as it applied to the mitigation of environmental consequences of electricity generation and consumption. Throughout the first decade of the twenty-first century, the president, the Congress, and most federal agencies also resisted efforts to create policy that directly addressed environmental concerns. This inaction occurred despite growing political pressure from within the United States and from other countries—especially those ratifying the Kyoto Protocol of 1997—to alleviate human-created (anthropogenic) climate change.[73]
Decision makers in several states tried to fill the policy void by providing incentives for environmentally preferable generation technologies and energy-efficiency programs. Specifically, by the end of 2006, 21 states (plus the District of Columbia) had created “renewable portfolio standards” that required power companies to produce (or to purchase) a certain amount of electricity coming from alternative resources over a set period.[74] Initially established as part of restructuring legislation in some states, the rules sought to encourage the use of biomass, wind, solar, hydro and other renewables and make them (with further development that would come from market pressures) more economically competitive with traditional fossil-fuel burning power plants. In Texas, Governor George W. Bush signed a 1999 law requiring 2,000 MW of renewable energy to be constructed by 2009.[75] (The legislature amended that goal to 5,880 MW by 2015.)[76] By the end of 2004, state suppliers had installed 1,293 MW of renewable energy facilities, most consisting of wind turbines. [77] (By the end of 2010, Texas appears to have exceeded its goals several years early, having constructed almost 11,000 MW of renewable electricity facilities, of which almost 10,000 MW consisted of wind turbines.[78]) Indeed, wind-turbine technology improved dramatically and had become hugely popular since the days of PURPA incentives. Early in the twenty-first century, companies (especially those based in Denmark, the United States, China, and Germany) produced reliable machines yielding power in the range of two to three megawatts each. (These machines compared to 1970s-vintage turbines that generated about 100 kilowatts each.)[79] In 2007, 2008, and 2009, wind-turbine generation constituted 35 percent or more of America’s newly installed electrical generation capacity, greater than that of coal-burning power plants.[80]
Beyond renewable portfolio standards, some states established “public benefit funds” (also known as “system benefit funds”). Often created in tandem with legislation that restructured utility systems, these organizations receive funding from a surcharge on power bills regardless of whether a traditional utility or nonutility company provides customers with electricity.[81] In Oregon, a 1999 restructuring law created the Energy Trust,[82] which employs a three-percent surcharge to pay for energy conservation, renewable energy sources, and efficiency efforts.[83] In 2008, using revenues of $77.6 million, the Trust claimed to have reduced demand by 32 MW (average) at a cost of 2.1 cents per kWh (levelized); it also trimmed use of 2.4 million therms of natural gas at a cost of 45 cents per therm. (Comparable costs would have been 8.8 cents per kWh and 72 cents per therm of gas, according to the Trust.) Meanwhile, it developed about 33 MW (average) of renewable resource capacity.[84] These efforts, which the organization maintained also provided benefits in the form of new jobs and enhanced environmental quality, have made the Trust an exemplar among advocates of similar public benefit funds.
On the other side of the country, the “Efficiency Vermont” program focuses only on demand-side services.[85] Funded by a charge on every electric bill and operating under contract to the Vermont regulatory body since 2000, this “energy efficiency utility” took over the demand reduction services previously performed by almost all the state’s utilities.[86] Employing contractors and partnerships with retailers, suppliers, and community-based service groups, the organization had a 2008 budget of about $31 million and claimed to have saved (in that year alone) 140,000 MWh at a cost of about 3 cents per kWh.[87] This cost compares favorably to the 14 cent per kWh price of utility-produced power.[88]
While only 16 states have some form of public benefit funds,[89] the organizations that manage them have removed (at least partially) the planning function from traditional utility companies. By statute and practice, these new entities pursue renewable energy programs and energy-efficiency efforts, activities that utilities previously pursued, though often half-heartedly,[90] thus reducing the clout of managers who once designed and built generating facilities to meet growing needs.
New Technology Configurations
In pursuing their goals, FERC, states, and the public benefit fund organizations exploited continuously changing technologies on the supply- and demand-sides of the energy equation. Other stakeholders used evolving hardware to suggest new permutations of the existing utility system or more radical changes to it. One such set of technologies consisted of cogeneration, renewable-energy, and gas-fired generation technologies—similar hardware that, when used by PURPA qualifying facilities in the 1980s, helped regulatory critics argue that utility companies should not remain viewed as natural monopolies. In the first decade of the twenty-first century, these technologies became more popular when configured within a new conceptual and practical framework known as distributed generation.
Recent views of the distributed generation (DG) configuration resemble Thomas Edison’s decentralized utility system of the 1880s. Instead of using large, centralized power plants and long-distance transmission lines, the DG model situates small-scale generating technologies near ultimate users, with little reliance on distribution and transmission facilities. DG technologies can offer power in a range of capacities—from a fraction of a kilowatt (as produced by solar photovoltaic cells) to a few kilowatts (delivered by backyard wind turbines or conventional internal combustion generators) to 100 MW or more (such as by gas combustion turbines and large arrays of renewable energy technologies).
While users of DG technologies lose the benefits of scale economies, they gain compensating advantages. Most important for some users, they often obtain power at reliability levels that cannot be achieved by utility-supplied electricity. Because they do not depend on the utilities’ transmission and distribution networks (which remain subject to failure), DG facilities can ensure consistent power supplies to manufacturing and service businesses that desperately need consistent, high-quality power.[91] And by building large numbers of localized generation facilities rather than a few large-scale power plants far from load centers, DG users can help defer or eliminate transmission upgrades and expansions—at a time when few companies want to invest investment in such facilities.[92] Perhaps most important in the post-September 11, 2001 era of concern about terrorism, DG technologies may improve the grid’s security. Decentralized power generation helps reduce the number of terrorist targets that nuclear facilities and other large centralized power plants offer, for instance. And in the event of an attack that causes a large generator to fail, DG better insulates critical power consumers.[93]
By 2007, American businesses and individuals owned about 12 million DG installations, mostly as backup units to provide emergency power when grid-supplied power becomes unavailable. Many of these technologies remain unremarkable, consisting of relatively inefficient gasoline or natural gas combustion units that see little use, despite having a combined nameplate capacity of about 200 GW.[94] More compelling in terms of altering traditional relationships between utilities and consumers are those technologies, such as wind and solar generators, connected to homes and businesses to supply power whenever the wind blows and the sun shines. Additionally, utilities in most states have been compelled (reminiscent of PURPA’s requirements) to purchase power that customers do not need for themselves, in a process known as net metering: when customers produce more power than they consume, they sell electricity into the grid, causing their meters to run in reverse.[95] Californians, for example, can win easy approval of prescreened hardware arrangements so the state can achieve the goal (established by law and regulatory proceedings) of obtaining 1,940 MW of solar-generated electricity capacity by 2016[96] and 33 percent of power from renewables by 2020.[97] In July 2010, more than 600 MW of solar-produced power capacity, coming from almost 65,000 customers, had already been connected to the grid.[98] Supported by public benefit funds,[99] the Department of Energy,[100] and many environmental advocates, distributed generation configurations such as these continue gain popularity.[101]
The Smart Grid and Further Possibilities
DG appears poised to become more widely used as it co-evolves and becomes integrated with the “smart grid.” Conceived of in the late 1990s,[102] the smart grid promises more control and opportunities to consumers in “a humming, real-time, interactive energy marketplace,” one that may not always involve traditional utility participants.[103] The key to achieving this promise lies in the automation of a multitude of devices attached to the grid, some of which add power to the network while others draw power from it. In one conceptualization of the smart grid, electrical appliances communicate with similar devices and to the grid itself, providing useful information from which consumers and power companies benefit. For example, “smart” water heaters, clothes dryers, and air conditioners could be turned off for a few minutes during system peak times (in an approach known as direct load control), thus enabling power companies to avoid generating expensive power or buying it from other suppliers.[104]
The smart grid’s potential has been demonstrated in pilot projects, and the Obama administration included several billion dollars for its implementation in “stimulus” funding legislation in 2009.[105] In one experiment run by Maryland’s Constellation Energy, customers with smart-grid equipped homes learned continuously of their power consumption and received information on the price of electricity, which fluctuated during the day depending to the utility’s production costs. The approach differs from one in which customers obtained information about use and pricing on their monthly bill, which arrived weeks after they consumed power, and it enabled people to reduce energy use by 22 to 37 percent.[106] In another test in which smart meters communicated between load-using equipment and utility company computers, Connecticut Light and Power customers reduced peak demand by 16 to23 percent.[107] The greater deployment of smart-grid enhanced appliances would augment these savings, say the technologies’ advocates. In a prototype General Electric refrigerator, for example, energy savings and peak demand reductions occur when the device, which will supposedly cost only $10 more than its “dumb” counterpart, delays the defrost cycle and ice making functions until electricity prices decline.[108] In the largest test to date, Xcel Energy has begun installing smart meters and control devices in about 50,000 homes in Boulder, Colorado.[109] Though initiated with great fanfare in March 2008, the “SmartGridCity”[110] project has seen public support wane, as some of the program’s costs have been passed on to consumers.[111] Similar projects elsewhere have encountered citizen opposition out of fear that smart grid implementation will increase prices.[112] Nevertheless, promoters hope to overcome early hiccups and realize the benefits of smart-grid implementation.
Besides opportunities to save energy and money, the smart grid offers consumers the chance to earn substantial income. As one example, consider the owners of hybrid gasoline-electric cars or fully electric vehicles whose batteries can be plugged in a wall outlet connected to the grid. Using equipment that links the car to the utility’s network, the batteries could be programmed to charge during off-peak hours, thus increasing the power company’s load factor. Moreover, if drivers do not expect to use their cars during high-usage times (such as in the late afternoon on hot days), they can sell power to the grid, thus reducing a utility’s need to start up peak-load equipment. Using net metering arrangements, customers who sell power (in a configuration often described as “vehicle-to-grid”) would reduce their electric bills.[113]
More enticing to some, the car batteries could provide ancillary services to the electric network—helping to regulate power quality in ways done traditionally by moderating the behavior of generation-plant equipment. Unlike the big fossil-fuel turbine-generators that maintain an almost constant frequency and voltage of alternating current, car batteries could provide the same services by near-instantaneous additions or reductions of power as dictated by smart control devices.[114] The principle has already been demonstrated using appliances that sense the frequency of alternating current in the grid and offer ancillary services when necessary.[115] In a pilot project performed by the PJM Interconnection and researchers at the University of Delaware, the regulation services provided by three electric vehicles earned between $7 and $10 daily.[116] This income—totaling $3,500 per year for such a configuration—has suggested the name of “CashBack cars” for the vehicles. Indeed, the value of the ancillary services provided by the electric cars dwarfed the earnings derived from selling energy into the grid, even during peak-rate periods.[117]
These smart-grid and DG examples offer a vision of how consumers can reconfigure their relationship with utilities. Instead of remaining simple consumers of power, they can become producers of electricity and providers of regulation and ancillary services. In extreme circumstances, they could even dispense with their relationship with traditional utilities—or at least develop associations with other players. Some enthusiasts have already suggested that companies (known as aggregators) will combine the contributions of hundreds of smart-grid-connected homes and businesses to sell into the wholesale market managed by regional transmission operators such as PJM; they would only occasionally purchase power from the local utility when they cannot produce enough power themselves. FERC Chairman Wellinghoff thinks that companies such as Google and Microsoft, which have already entered the home power monitoring business,[118] would constitute natural aggregators due to their experience with consumers and the Internet.[119] Indeed, as the wholesale market becomes more amenable to both power generators and demand response, with smart-grid technologies seeing use in unusual ways, the involvement and sway of traditional utilities may diminish.[120]
Unlikelihood of New Consensus
With several stakeholders pursuing various agendas, a clear road toward a stable consensus along the lines that existed before 1970—or one that emerged in the late 1990s as restructuring gained adherents—appears elusive. Novel technologies, such as small-scale distributed generation facilities and smart electronics used for demand response, offer stakeholders fresh possibilities for changing the configuration of the utility system. At the same time, huge uncertainties remain within the political framework, especially relating to initiatives responding to the threat of climate change. These uncertainties make it difficult to predict whether large-scale, “carbon friendly” nuclear plants will be constructed, in which case traditional utility companies would perhaps re-acquire influence because they enjoy greater access to capital markets and government assistance.[121] Doubts about future federal environmental policy, meanwhile, hinder even more-rapid adoption of renewable energy generation technologies, which nonutility companies and other untraditional players could employ to their benefit.
The flux in the system has increased too as American society appears to have entered a period of questioning about the value of both free-market institutions and government regulation of business. The California electricity crisis of 2000-2001, for example, highlighted the ways in which private companies such as Enron manipulated the market for private gain and public pain.[122] Outside the utility realm, the early 2000s saw widespread abuse of business managers’ power that led to bankruptcies of large firms such as WorldCom and Adelphia. The excesses contributed to passage of legislation—the Sarbanes-Oxley Act of 2002—that sought to increase corporate responsibility.[123] The law appears to have little impact however, as leaders of major financial institutions at decade’s end took oversized risks with poorly understood instruments, precipitating the most severe recession since the Great Depression of the 1930s. The bankruptcy of just one company in 2008, Lehman Brothers Holding, eradicated more than $600 billion in shareholder wealth.[124] Soon after, the failure of General Motors cost investors $91 billion; a taxpayer-funded bailout of billions more helped prevent the giant firm’s demise and a tsunami effect throughout the broader economy.[125] At the same time, political pundits questioned government regulatory bodies, such as the Securities and Exchange Commission, which appeared either incompetent or incapable of overseeing industries that led the nation into desperate economic straits.[126]
These recent events have dulled the extreme positions taken by advocates of both restructuring and regulation. On one hand, deregulation ideologues now rarely make claims of extravagant benefits that would automatically flow from more competitive markets. While policy makers may reject the legitimacy of natural monopoly status for electric utilities, once a significant rationale for regulation, they remain leery of the free market in the peculiar, wired realm of electricity; skepticism has increased especially as several states experienced electricity price hikes in their restructured environments. On the other hand, defenders of regulation remain chastened by frequent examples of poor government oversight. They may also be disheartened by situations in which renewed regulation brought little relief either, as was the case in Virginia, which ended its restructuring program in 2007 but suffered dramatically higher power prices nevertheless.[127]
In short, much has changed in the fifteen years since the establishment of a near consensus within the utility system based on free-market principles and less regulation. Rather than moving more vigorously toward retail competition and customer choice, many states have done the opposite—retreating from deregulation and reinstating forms of government oversight, though not always with optimal outcomes. The ideological fervor that stoked deregulation efforts, meanwhile, has faded as the experiments in competition highlighted business abuses and governments’ inability to harness them effectively. At the same time, greatly empowered parties such as FERC, environmental advocates, and public benefit funds, continue to demonstrate the value of reducing demand and employing renewable energy facilities as cost-effective alternatives to construction of conventional generating capacity. And the use of novel technologies, such as distributed-generation devices that coordinate with smart-grid hardware to produce electricity or reduce its consumption, continues to alter relationships among stakeholders. As a result of this continuing flux within a complex social and technological system, it appears that no new utility consensus will emerge any time soon.
Richard Hirsh is Professor of Science and Technology Studies at Virginia Tech
[1] The rise and fall of the Power Exchange and the California ISO are explored in Tyler Hodge and Carol A. Dahl, “Power Market Pricing Behaviro in the California Power Exchange,” Energy Economics, no. 2 (2012): 568-75.
[2] Kenneth Howe, “D-Day for Electricity Deregulation / Starting now, customers can choose power vendors,” San Francisco Chronicle, 31 March 1998 http://www.sfgate.com/news/article/D-Day-for-Electricity-Deregulation-Starting-3010149.php, accessed 1 October 2013.
[3] Kenneth Howe, “It’s Lights, Cameras and Deregulation,” San Francisco Chronicle, 1 April 1998, B1.
[4] Ryan Wiser et al., “Green Power Marketing in Retail Competition: An Early Assessment,” (Golden, CO: National Renewable Energy Laboratory, 1999), 17.
[5] Nancy Vogel, “How State’s Consumers Lost with Electricity Deregulation,” Los Angeles Times, 9 December 2000, A1.
[6] In July 2000, a consumer advocate argued that the “dysfunction of the state’s electric market has been quick and startling,” resulting in the residential price of electricity tripling within 45 days. Michael Shames, “San Diego’s Energy Woes Will Grow,” San Diego Union-Tribune, 7 July 2000, B9, from LexisNexis Academic, accessed 10 January 2011.
[7] Mark Golden, “Power Points: ‘Infant’ Market Reacts Rationally to Cap,” Dow Jones Energy Service, 30 June 2000, from Factiva, accessed 1 October 2013.
[8] “Dynegy’s Watson Tours the New Horizon,” Petroleum Intelligence Weekly, 18 September 2000.
[9] Chart prepared by California Public Utility Commission, Energy Division. Data from California Independent System Operator (http://www.caiso.com/docs/2001/03/22/2001032214552322811.pdf) and Department of Water Resources Revenue Requirement Draft Filing, accessed 19 October 2001.
[10] The company reorganized and exited bankruptcy in June 2003. See California Public Utilities Commission, “Judge Announces Settlement to End PG&E Bankruptcy,” 19 June 2003, at http://docs.cpuc.ca.gov/published/NEWS_RELEASE/27310.htm.
[11] See, for example, Lynda Gledhill, “Lawmakers devise rival bailout plans for Edison; Push to come up with alternative to bankruptcy before recess,” San Francisco Chronicle, 18 July 2001, A14; and Jerry Hirsch, “Idea of Edison Bankruptcy Gains Currency,” Los Angeles Times, 2 September 2001, C1.
[12] Vogel, “How State’s Consumers Lost with Electricity Deregulation.”
[13] Edythe S. Miller, “Economic Regulation and New Technology in the Telecommunications Industry,” Journal of Economic Issues 30, no. 3 (1996): 719-35.
[14] David Lazarus, “Davis Calls For Brake On Electric Rate Hikes / He calls San Diego rise `totally unacceptable’,” San Francisco Chronicle, 28 July 2000, A1.
[15] Richard H.K. Vietor, “Contrived Competition: Economic Regulation and Deregulation, 1920s-1980s,” Business History 36, no. 4 (October 1994): 1-32. Customers who had contracts with nonutility suppliers could keep those contracts until they expired, however.
[16] Eric Hirst, The California Electricity Crisis: Lessons for Other States (Washington, DC: Edison Electric Institute, 2001), 4.
[17] Steven Pearlstein, “On California Stage, A Cautionary Tale; Prices, Blackouts Spotlight Deregulation’s Risks,” Washington Post, 21 August 2001, A1.
[18] David Lazarus, “Whistle-Blowers Give Evidence to PUC that Prices Were Illegally Manipulated,” San Francisco Chronicle, 19 May 2001, at http://www.sfgate.com/cgi-bin/article.cgi?f=/c/a/2001/05/19/MN27574.DTL, accessed 10 January 2011.
[19] “AES Cuts California Capacity in Half Due to NOX Limits,” Megawatt Daily 5 (No. 223, 22 November 2000), from Factiva, accessed10 January 2011; “Clean Air Rules Put Power-Crunched California in Worse Winter Trouble,” Electric Utility Week (27 November 2000), 1, from Factiva, accessed 10 January 2011; and Michelle Devera, “California Skirts Energy Disaster with Near-System Failures,” California (9 December 2000), A1, from Factiva, accessed 10 January 2011.
[20] Loretta Lynch, president of the CPUC, and other state officials claimed that these generating companies deliberately withheld power from the market as a way to increase prices. See Harvey Wasserman, “Power Struggle,” Multinational Monitor (1 June 2001), 9, from Factiva, accessed 10 January 2011.
[21] Ricardo Alonso-Zaldivar and Richard Simon, “Power Firms Are Ordered to Turn Over Trading Data Energy: Regulators seek to determine if sellers tried to manipulate the California market,” Los Angeles Times, 9 May 2002, A1; Mark Martin, “‘Smoking gun’ Enron memos / ‘Death Star,’ ‘Get Shorty’ strategies show how firm manipulated energy to state in attempt to boost profits,” The San Francisco Chronicle, 7 May 2002, A1; “California short-circuits,” The Globe and Mail, 13 May 2002, A1; and Steven Pearlstein, “The $3,880 Megawatt-Hour; How Supply, Demand and Maybe ‘Market Power’ Inflated a $273 Commodity,” The Washington Post, 21 August 2001, A9.
[22] Federal Energy Regulatory Commission, “Final Report on Price Maniuplation in Western Markets,” (Washington, DC, 2003), ES-1.
[23] Enron’s rise and fall has been documented by many authors. The most compelling accounts were written by journalists, such as Rebecca Smith and John R Emshwiller, 24 days: How Two Wall Street Journal Reporters Uncovered the Lies that Destroyed Faith in Corporate America (New York: Harper Business, 2003), Bethany McLean et al., “Why Enron Went Bust,” Fortune 144 (24 December 2001): 58-68, and Bethany McLean, Peter Elkind, and Suzanne Kousdsi, “Partners in Crime,” Fortune 148 (27 October 2003): 78-100. Of course, other companies also exploited the system, though Enron did so most egregiously, as is noted in a statement by California Senator Dianne Feinstein, which described gaming of the market by Reliant, Dynergy, and El Paso Merchant Energy. “Statement of Senator Dianne Feinstein: Manipulation of the California Energy Market,” Congressional Record 150 (No. 78), 108th Congress, 7 June 2004, at http://feinstein.senate.gov/04Speeches/enrontapes.htm, accessed 7 February 2011.
[24] A major pipeline exploded in New Mexico in August 2000, reducing the ability of Californians from obtaining natural gas. Ahmad Faruqui, Hung-po Chao, Vic Niemeyer, Jeremy Platt, and Karl Stahlkopf, “Analyzing California’s Power Crisis,” Energy Journal 22 (October 2001), from Factiva, accessed 22 February 2012.
[25] U.S. Department of Energy, Energy Information Administration, data from http://tonto.eia.doe.gov/oog/ftparea/wogirs/xls/ngm23vmall.xls, accessed 30 May 2002.
[26] Lynda V. Mapes, “How Dry We Are: Power to Stay Tight,” Seattle Times, 6 February 2001, A1..
[27] Higher wholesale prices affected not just Californians, but others in the northwest: Seattle customers saw rates jump by 28% in early 2001, and the government-run Bonneville Power Administration threatened to raise wholesale rates by 250% by fall. Hal Bernton, “NW Utilities Get Socked the Hardest,” Seattle Times, 13 April 2001, A1.
[28] Ralph Cavanagh, “Revisiting ‘the Genius of the Marketplace:’ Cures for the Western Electricity and Natural Gas Crises,” The Electricity Journal 14, no. 5 (2001): 11-18.
[29] Peak demand and consumption figures have been adjusted for growth and weather conditions. Data provided by the California Energy Commission at http://www.energy.ca.gov/electricity/peak_demand/DEMAND_REDUCTION.XLS, accessed 23 May 2002. Also see Ralph Cavanagh, “California Overcomes an Electricity Crisis,” The Electricity Journal 15, no. 1 (2002): 92-3.
[30] Paul Krugman, “The Power Perplex,” New York Times, 26 February 2002, A25.
[31] Jessica Berthold, “California May Be Making Progress On Reworking Pwr Deals,” from Dow Jones Energy Service, 8 April 2002.
[32] After revelations of Enron’s activities, other companies, such as Dynergy, and CMS Energy Corporation allowed that they too had participated in some trading activities that, the companies claim, may not have been illegal, though they may have been somewhat deceptive. Chip Cummins, Jathon Sapsford, and Thaddeus Herrick, “Watson, Who Long Led Dynergy in Enron’s Chadow, Steps Down,” Wall Street Journal, 29 May 2002, A1.
[33] See, for example, Severin Borenstein, “The Trouble with Electricity Markets: Understanding California’s Restructuring Disaster,” Journal of Economic Perspectives 16 (Winter 2002): 191-211. Other excellent studies of the crisis include Carl Blumstein, L.S. Friedman, and R.J. Green, “The History of Electricity Restructuring in California,” Center for the Study of Energy Markets (CSEM) Working Paper 103, August 2002; Severin Borenstein, James B. Bushnell, and Frank A. Wolak, “Measuring Market Inefficiencies in California’s Restructured Wholesale Electricity Market,” American Economic Review 92 (December 2002): 1376-1405; and James Bushnell, “California’s Electricity Crisis: A Market Apart?” CSEM Working Paper 119, November 2003.
[34] Pearlstein, “On California Stage, A Cautionary Tale; Prices, Blackouts Spotlight Deregulation’s Risks.”
[35] U.S. Department of Energy, Energy Information Administration, at http://www.eia.doe.gov/cneaf/electricity/chg_str/regmap.html.
[36] “Pennsylvania Gov. Ridge to National Energy Summit: Marketplace Solutions Must be Linchpin of Energy Policy,” PR Newswire, 20 March 2001.
[37] Benjamin Y. Lowe, “Pennsylvania, New Jersey Receive No Savings from Power Competition,” Philadelphia Inquirer, 20 May 2002, from Factiva, accessed 14 March 2011.
[38] U.S. Department of Energy, Energy Information Administration, “Participation lags in most electricity retail choice States,” Today in Energy, 19 May 2011, at http://www.eia.gov/todayinenergy/detail.cfm?id=1450, accessed 14 February 2012. For more information on the decline in interest in competition in Pennsylvania, see Jeff Gelles, “The Philadelphia Inquirer Consumer Watch Column,” Philadelphia Inquirer, 26 May 2002, from Factiva, 13 November 2010; “Electricity Deregulation A Must,” Patriot News (Harrisburg, PA), 9 April 2009, A15; Daniel Victor and M. Diane McCormick, “Competition might ease bills’ shock // The expiration of PPL’s rate cap means the utility will charge 30 percent more, but it also means other generators are likely to enter the market with lower prices.,” Patriot News, 25 October 2009, A1; Jake Smeltz, “Electric restructuring is providing benefits,” letter to the editor at http://www.pennlive.com/letters/index.ssf/2010/03/electric_restructuring_is_prov.html; and Camille “Bud” George, “All signs point to electric deregulation failure,” Patriot-News, at http://www.pennlive.com/editorials/index.ssf/2010/03/all_signs_point_to_electric_de.html.
[39] U.S. Department of Energy, Energy Information Administration, “Participation lags in most electricity retail choice States,” Today in Energy, 19 May 2011, at http://www.eia.gov/todayinenergy/detail.cfm?id=1450, accessed 14 February 2012.
[40] Susan Combs, “The Energy Report,” (Austin, TX: Texas Comptroller of Public Accounts 2008), 355.
[41] Ibid., 356.
[42] U.S. Department of Energy, Energy Information Administration, “Electricity retail choice is mandated in Texas and growing in three States,” Today in Energy, 18 May 2011, at http://www.eia.gov/todayinenergy/detail.cfm?id=1430, accessed 14 February 2012.
[43] Ibid., 357. Some critics of deregulation point out that electricity prices in Texas are greater than those in neighboring states. Jack Z. Smith “Texas’ Retail Electric Rates Significantly Higher than Neighboring States’,” Fort Worth Star-Telegram, 12 December 2009, D1. The Department of Energy’s Electric Power Monthly report for December 2009 shows that Texas’ average retail price for electricity for all sectors stood at 9.64 cents per kWh, which compared to the Arkansas rate of 7.5 cents per kWh and the Oklahoma rate of 6.49 cents per kWh. http://www.eia.doe.gov/cneaf/electricity/epm/table5_6_a.html, accessed 22 March 2010. The continuing debate is described in Kate Galbraith, “Electricity deregulation debate continues; Research is unclear whether Texans saving,” San Angelo Standard-Times, 13 July 2010, from Factiva, accessed 11 January 2011.
[44] Public Utility Commisson of Texas, “Report to the 81st Texas Legislature: Scope of Competition in Electric Markets in Texas,” (Austin, TX, 2009), introductory letter.
[45] U.S. Department of Energy, Energy Information Administration, “Electricity retail choice is mandated in Texas and growing in three States,” Today in Energy, 18 May 2011, at http://www.eia.gov/todayinenergy/detail.cfm?id=1430, accessed 14 February 2012.
[46] Paul Davidson, “Shocking Electricity Prices Follow Deregulation,” in USA Today (2007). http://www.usatoday.com/money/industries/energy/2007-08-09-power-prices_N.htm, accessed 15 August 2007. Also see Martin Weil, “Electricity Bills in Maryland May Rise: Legislators Attack Plans for Increases of up to 72 Percent,” Washington Post, 8 March 2006, D1; Travis Madsen et al., “Energy Saved, Dollars Earned: Real-World Examples of How Energy Efficiency Can Benefit Maryland Consumers,” (Baltimore, MD: Maryland PIRG Foundation, 2008); and Steven Pearlstein, “Deregulation’s Unkept Promise,” The Washington Post, 1 June 2007, D1.
[47] Greg Edwards, “Power Regulation Approved,” Richmond Times-Dispatch, 5 April 2007, from Factiva.
[48] “Maryland Stalemate Leads Governor to Propose Partial Re-Regulation,” The Electricity Journal 22, no. 4 (2009): 9. Several Maryland senators introduced Senate Bill 807 on 10 February 2010, “An Act concerning Electricity Market—Goal of the State—Best Possible Price for Ratepayers through Reregulation,” at http://mlis.state.md.us/2010rs/billfile/SB0807.htm, accessed 9 March 2010. The governor was not successful in pushing through his reregulation bill, however, and in December 2009, he urged the state regulatory commission to use its authority to order construction of new generation facilities and create a balanced energy mix as part of long-term strategy to ensure “affordable, reliable, and clean energy.” “Governor Martin O’Malley Urges Public Service Commission to Order New Electricity Production,” statement issued 18 December 2009, at http://www.governor.maryland.gov/pressreleases/091218.asp.
[49] U.S. Department of Energy, Energy Information Administration, at http://www.eia.doe.gov/cneaf/electricity/page/restructuring/restructure_elect.html, accessed 9 March 2010.
[50] A detailed chronology of events is contained in the US-Canada Power System Outage Task Force, “Final Report of the August 14, 2003 Blackout in the United States and Canada: Causes and Recommendations,” chapter 5, April 2004, at https://reports.energy.gov/BlackoutFinal-Web.pdf.
[51] U.S. General Accounting Office, “Electricity Restructuring: 2003 Blackout Identifies Crisis and Opportunity for the Electricity Sector,” GAO-04-204, November 2003, appendix 1, 9.
[52] Jack Casazza, Frank Delea, and George Loehr, “Contributions of the Restructuring of the Electric Power Industry to the August 14, 2003 Blackout,” Issue Paper on Reliability and Competition, August 2005, issued by the Power Engineers Supporting Truth, at http://www.crhnet.ca/casestudies/blackout/restructuring_contributions.pdf; and Jack Casazza, “Electric Power Deregulation—A Bad Idea?” IEEE-USA Today’s Engineer online, May 2005, at http://www.todaysengineer.org/2005/May/deregulation.asp, accessed 6 February 2009.
[53] Despite the lack of evidence that transmission lines cause illness, utility companies should not downplay such fears, according to Chris Hilen, “High-Voltage Electric Transmission Line Upgrades: The Value of Good Corporate Citizenship,” The Electricity Journal 16, no. 7 (August-September 2003): 95-102. Not every researcher is as sure of the safety of radiation near power lines, as is noted in Stephen J. Genuis, “Fielding a current idea: exploring the public health impact of electromagnetic radiation,” Public Health 122, no. 2 (2008): 113-24.
[54] “The transmission grid is rundown because deregulation dangled big Enron-sized dollars in front of utilities and instead of attending to infrastructure, utilities chased electricity trading money. The grid is a mess because there wasn’t enough concern about controlling all these new, deregulated companies.” John Wilson, “Close deregulated electricity market,” Toronto Star, 10 December 2003, A29, at http://www.ontariotenants.ca/electricity/articles/2003/ts-03l10.phtml, accessed 5 February 2011. Mr. Wilson is described as an “energy consultant and a former board member of Hydro One.”
[55] “Reliable Power: Renewing the North American Electric Reliability Oversight System,” (Princeton, NJ: North American Electric Reliability Council, 1997).
[56] Jay Apt, Lester B. Lave, Sarosh Talukdar, M. Granger Morgan, Marija Ilic, “Electrical Blackouts: A Systemic Problem,” Issues in Science and Technology 20 (Summer 2004): 55-61.
[57] As early as 1997, a NERC panel noted that “the voluntary system through which NERC and the Regional Councils have ensured reliability will not suffice in the restructured future when a larger group of competitors replaces today’s vertically integrated utilities.” North American Electric Reliability Council, NERC Electric Reliability Panel, “Reliable Power: Renewing the North American Electric Reliability Oversight System,” Final, Prepublication Copy, December 22, 1997, 3.
[58] Final Report of Blackout, 11, 140-41.
[59] Energy Policy Act of 2005, Public Law 109-58, signed 8 August 2005, Title XII, Section 1211.
[60] Timeline from NERC, “Company Overview: History,” at http://www.nerc.com/page.php?cid=1%7C7%7C11, accessed 13 February 2009. As part of transition from a voluntary member organization to an independent authority that enforces compliance, the NERC changed its name to the North American Electric Reliability Corporation (instead of “Council”). See NERC, “Company Overview: FAQ,” at http://www.nerc.com/page.php?cid=1%7C7%7C114, accessed 13 February 2009.
[61] Energy Policy Act of 2005, Title XII, Section 1221.
[62] Commentary on the implications of the law in ICF Consulting, “2005 Energy Act: The Impacts on Electric Transmission,” 5 August 2005, at http://www.icfi.com/Markets/Energy/Energy-Act/electric-transmission.pdf, accessed 15 August 2005.
[63] Debbie Swanstrom and Meredith M. Jolivert, “DOE Transmission Corridor Designations and FERC Backstop Siting Authority: Has the Energy Policy Act of 2005 Succeeded in Stimulating the Development of New Transmission Facilities?” Energy Law Journal 30 (1 July 2009): 415, from Factiva; and FERC, “Promoting Transmission Investment through Pricing Reform,” 18 CFR part 35, docket RM06-4-000, order 679, 20 July 2006, at http://www.ferc.gov/whats-new/comm-meet/072006/E-3.pdf.
[64] Letter from Governor Timothy M. Kaine and Attorney General Robert F. McDonnell to U.S. Department of Energy Secretary Samuel W. Bodman, “Re: Comments of the Governor and Attorney General of Virginia, Draft National Interest Electric Transmission Corridor Designations; Attn: Docket No. 2007-OE-01, Mid-Atlantic Area National Corridor, at http://conserveland.org/pp/Transmission/KaineMcDonnell_NIETC_July2007.pdf, accessed 13 February 2009. Pennsylvania Governor Edward G. Rendell sent a similar letter to Secretary Bodman on 8 June 2007. It can be found at http://conserveland.org/pp/Transmission/nietc_rendell.pdf. See also “National Transmission Corridors Now Official, and States’ Negative Reactions Follow Quickly,” Power Markets Week (8 October 2007), 14, from Factiva; Jeff Barber and Kathy Larsen, “Three States Challenge DOE on Corridors; Pennsylvania also Takes the Matter to Court,” Electric Utility Week (12 November 2007), 17 from Factiva; Kathy Ruff, “Corridor’s Cost: Local Control Over Power Lines,” Northeast Pennsylvania Business Journal (1 August 2007), 58, from Factiva; and Janice Crompton, “Land Owners Against Power Line Plan; Some Homeowners Opt to Join Lawsuit,” Pittsburgh Post-Gazette (15 July 2007), W1, from Factiva; and “National Transmission Corridors Now Official, and States’ Negative Reactions Follow Quickly,” Power Markets Week (8 October 2007), 14, from Factiva.
[65] “US Govt Designates Power Transmission Corridors,” Dow Jones News Service (2 October 2007), from Factiva.
[66] Kurt Yeager and Clark W. Gellings, “Preventing Blackouts,” Issues in Science & Technology 21 (Fall 2004), 7-8.
[67] For more about system problems, see Apt, “Electrical Blackouts: A Systemic Problem,” 55-61.
[68] FERC’s efforts to encourage wholesale competition by opening access of the transmission network to various players culminated in Order 888, issued in 1996 and clarified through 2006. FERC Order No 888, “Promoting Wholesale Competition through Open Access, Non-discriminatory Transmission Services by Public Utilities,” 75 FERC 61,080, issued 24 April 1996. For a history of FERC documents relating to this order, see FERC “Order No. 888,” http://www.ferc.gov/legal/maj-ord-reg/land-docs/order888.asp, accessed 7 January 2011. For a discussion of FERC’s failed effort to create a national standard market design, see Richard Green, “Electricity Wholesale Markets: Designs Now and in a Low-Carbon Future,” Energy Journal 29 (1 December 2008), 95, from Factiva.
[69] FERC, “Commission Outlines Policy to Support Formation of Independent Transmission Companies,” news release, Docket Number PL05-11-000, 27 June 2005, at http://www.ferc.gov/news/news-releases/2005/2005-2/06-27-05-trans-policy.asp, accessed 2 April 2010. For information on some of these transmission firms, see their home pages at http://www.itctransco.com/ and http://www.trans-elect.com/.
[70] FERC Order 719, issued 17 October 2008, 125 FERC 61,071, “Wholesale Competition in Regions with Organized Electric Markets,” at http://www.ferc.gov/whats-new/comm-meet/2008/101608/E-1.pdf, accessed 12 February 2009, 1-2.
[71] See companies’ websites at http://www.energyconnectinc.com/ and http://www.enernoc.com/.
[72] FERC Web site, “Demand Response,” at http://www.ferc.gov/industries/electric/indus-act/demand-response.asp; and “Chairman Wellinghoff’s Statement on Demand Response Report,” at www.ferc.gov/news/statements-speeches/wellinghoff/2009/06-18-09-wellinghoff.asp.
[73] See John Byrne et al., “American policy conflict in the greenhouse: Divergent trends in federal, regional, state, and local green energy and climate change policy,” Energy Policy 35, no. 9 (2007):4555-73; and Paul G. Harris, “Beyond Bush: Environmental politics and prospects for US climate policy,” Energy Policy 37, no. 3 (2009): 966-71.
[74] Ryan Wiser et al., “The Experience with Renewable Portfolio Standards in the United States,” The Electricity Journal 20, no. 4 (2007): 9.
[75] Ryan Wiser and Ole Langniss, “The Renewables Portfolio Standard in Texas: An Early Assessment,” (Lawrence Berkeley National Laboratories, 2001).
[76] Texas Utilities Code §39.904, as noted in Database of State Incentives for Renewables and Efficiency, last updated 13 March 2013, at http://www.dsireusa.org/incentives/incentive.cfm?Incentive_Code=TX03R, accessed 2 October 2013.
[77] David Garman, Assistant Secretary of Energy Efficiency and Renewable Energy of the U.S. Department of Energy, speaking at Senate Committee on Energy and Natural Resources, 8 March 2005, at http://www1.eere.energy.gov/office_eere/congressional_test_030805.html, accessed 7 February 2011.
[78] U.S. Department of Energy, Energy Information Administration, “Texas Renewable Electricity Profile 2010,” at http://www.eia.gov/renewable/state/texas/, accessed 2 October 2013.
[79] U.S. Department of Energy, National Renewable Energy Laboratory, “Wind Power Today: 2010,” document DOE/GO-102010-3011, May 2010, 7-8 at http://www1.eere.energy.gov/windandhydro/pdfs/47531.pdf.
[80] Ryan Wiser and Mark Bolinger, Annual Report on U.S. Wind Power Installation, Cost, and Performance Trends: 2007, Report DOE/GO-102008-2590 (Washington, DC: U.S. Department of Energy, 2008), 4; American Wind Energy Association, Annual Wind Industry Report: Year Ending 2008 (Washington, DC: AWEA, 2009), 2 at http://www.awea.org/publications/reports/AWEA-Annual-Wind-Report-2009.pdf; and American Wind Energy Association, U.S. Wind Industry Annual Market Report: Year Ending 2009, at http://www.awea.org/reports/Annual_Market_Report_Press_Release_Teaser.pdf. This trend may have ended in 2010, due to lack of supportive federal policy initiatives. See Kennedy Maize and Robert Peltier, “The US Power Industry 2011: The Sequel,” Power 155 (January 2011): 27-30. Steven Mufson, “Coal’s burnout: Have investors moved on to cleaner energy sources?,” Washington Post, 1 January 2011.
[81] Steven Nadel and Marty Kushler, “Public Benefit Funds: A Key Strategy for Advancing Energy Efficiency,” The Electricity Journal 13, no. 8 (2000): 74-84; Stephan Vachon and Fredric C. Menz, “The role of social, political, and economic interests in promoting state green electricity policies,” Environmental Science & Policy 9, no. 7-8 (November-December 2006): 652-62; Fredric C. Menz and Stephan Vachon, “The effectiveness of different policy regimes for promoting wind power: Experiences from the states,” Energy Policy 34, no. 14 (2006): 1786-96. The early effects of these funds are discussed in Clean Energy States Alliance, “CESA Year One: A Report on Clean Energy Funds in the U.S., 2003-2004,” August 2004, at http://www.cleanenergystates.org/.
[82] About 74 percent of these funds go to the Energy Trust; the remainder is used for energy efficiency efforts in public schools and for low-income housing.
[83] Section 3 (1) of A Bill for an Act Relating to Restrucutring of Electric Power Industry, 70th Oregon Legislative Assembly (June 29, 1999).
[84] Energy Trust of Oregon, “Growing a Sustainable Energy Future: 2008 Annual Report,” (Portland, OR: Energy Trust of Oregon, 2008). This figure of 33 MW of renewable capacity is the average amount of power produced by sometimes variable sources of power. In other words, if a set of wind turbines has a maximum (“nameplate”) capacity of 30 MW but only operates one-third of the time (i.e., when the wind blows), its average capacity is listed as 10 MW.
[85] Efficiency Vermont, “Efficiency Vermont Fact Sheet,” http://www.efficiencyvermont.org/pages/Common/AboutUs/.
[86] The history of the energy efficiency utility can be found in the 1999 settlement among electric utilities and other parties and endorsed by the Vermont Public Service Board in Vermont Public Service Board, “Investigation into the Department of Public Service’s Proposed Energy Efficiency Plan Re: Phase II,” in Docket No. 5980, ed. Vermont Public Service Board (Montpelier, VT, 1999).. Also see Vermont Public Service Board, “Energy Efficiency Utility Creation and Structure,” http://psb.vermont.gov/utilityindustries/eeu/generalinfo/creationandstructure, accessed 24 February 2010.
[87] Presentation of Andrea McHugh, Vermont Public Service Board, “Electric Energy Efficiency in Vermont,” 30 June 2008, at www.narucpartnerships.org/Documents/McHugh-Energy%20Efficiency.ppt, accessed 24 February 2010.
[88] Efficiency Vermont, “Annual Report 2008,” (Burlington, VT: Efficiency Vermont, 2008), i-ii.
[89] Clean Energy States Alliance, “Our Mission,” www.cleanenergystates.org, accessed 25 February 2010.
[90] Of course, good reasons exist for this indifference: Utilities in traditionally regulated states generally could not treat energy-efficiency activities as capital improvements on which they could earn a solid rate of return.
[91] Edward M. Meyers and Mannshya Grace Hu, “Clean Distributed Generation: Policy Options to Promote Clean Air and Reliability,” The Electricity Journal 14, no. 1 (January-February 2001): 89-98.
[92] Perhaps incongruously, DG facilities also offer potential advantages for improving the transmission of power. Because they produce power locally for users, they aid the entire grid by reducing demand during peak times and by minimizing congestion of power on the network, one of the causes of the 2003 blackout.
[93] The author participated in a National Science Foundation project called “Electric Power Networks Efficiency and Security,” established after the 2001 terrorist attacks, to develop, among other things, “new techniques and innovative tools for fault-tolerant and self-healing networks… and damage control systems for continuity of service during major disruptions.” NSF, “NSF/ONR Partnership in Electric Power Networks Efficiency and Security (EPNES),” (Arlington, VA: National Science Foundation 2002), 2. The benefits of distributed generation have been summarized well in U.S. Department of Energy, The Potential Benefits of Distributed Generation and Rate-Related Issues That May Impede Their Expansion, February 2007, at http://www.oe.energy.gov/epa_sec1817.htm.
[94] Ibid., I-7, 3. This 2007 survey indicated that about 12 million DG units yielded approximately 200 GW of capacity, about 20% of summer 2005 generating capacity in the United States. However, more than 99% of these units were most small, reciprocating engine generators or photovoltaic systems, the first of which only saw use during emergencies. For comparison, the nameplate capacity of generation facilities reported to the Department of Energy totaled about 1,088 MW in 2007. U.S. Department of Energy, Energy Information Administration, Electric Power Annual 2007, DOE/EIA-0348(2007) at http://tonto.eia.gov/FTPROOT/electricity/034807.pdf, 25, accessed 31 January 2011.
[95] Customers’ bills reflect the net consumption of electricity (or a credit if they produced more power than they consumed). Of course, most (if not all) of the meters used for net metering are electronic and do not have the rotating wheel (as in the analog meters) that could literally move in the reverse direction.
[96] California Public Utilities Commission, “About the California Solar Initiative,” at http://www.cpuc.ca.gov/PUC/energy/Solar/aboutsolar.htm, accessed 7 January 2011.
[97] California Governor Arnold Schwarzenegger established the 33 percent goal with Executive Order S-14-08, signed 17 November 2008. California Energy Commission, “Implementing the Renewable Energy Executive Order,” at http://www.energy.ca.gov/33by2020/index.html, accessed 7 January 2011.
[98] California Public Utilities Commission, “California Solar Initiative Annual Program Assessment,” issued 30 June 2010, at http://www.cpuc.ca.gov/NR/rdonlyres/CE1D2316-405C-4C94-A805-A68A1988D640/0/2010APA_final.pdf, 8, accessed 12 January 2011.
[99] See, for example, the efforts made by the Clean Energy States Alliance, a consortium of several public benefit funds and state agencies that advances work on environmentally preferable DG technologies. http://www.cleanenergystates.org.
[100] The U.S. Department of Energy supports research and demonstration projects of DG configurations. A description of some of the projects, managed in conjunction with utilities, industrial firms, universities, and industrial companies, consists of U.S. DOE, “Enhancing the Smart Grid: Integrating Clean Distributed and Renewable Generation,” 2 Sept. 2009, at http://www.oe.energy.gov/DocumentsandMedia/RDSI_fact_sheet-090209.pdf, accessed 7 January 2011.
[101] As compelling as these DG technologies appear, their widespread use has been slowed by technical and social impediments. These novel technologies often carry high first costs; renewable DG technologies, for example, cost more to install, but their fuel costs remain zero and other operating costs are small. Still, financing such capital intensive technologies often remains difficult. Interconnection with the grid also remains problematic. Homeowners using photovoltaics, wind systems, or even fossil-fuel generators often need to pursue grueling technical and administrative efforts to connect their equipment to the local utility’s grid safely and arranging for equitable ways to receive payment for the power they produce. Nonutility companies generating amounts of power that go beyond local demand from large-scale wind or solar generators encounter other problems, such as creating a need for expensive transmission facilities to be built between sometimes isolated generators and load centers. DG technologies also suffer from “not-in-my-backyard” objections. Large wind turbines, for instance, rouse public opposition, partly because they are so obvious on the landscape (or seascape), unlike the highly concentrated, isolated, and difficult-to-detect fossil-fuel and nuclear power plants they supplement. Some of the disincentives of DG are described in Benjamin K. Sovacool, “Distributed Generation (DG) and the American Electric Utility System: What is Stopping It?” Journal of Energy Resources Technology 130 (March 2008) at DOI: 10.1115/1.2824296; and Benjamin K. Sovacool, “Rejecting Renewables: The Socio-technical Impediments to Renewable Electricity in the United States,” Energy Policy 37 (November, 2009): 4500-13, at http://dx.doi.org/10.1016/j.enpol.2009.05.073. Public opposition to wind turbines based on their appearance has been documented as early as 1987 in Robert L. Thayer and Carla M. Freeman, “Altamont: Public Perceptions of a Wind Energy Landscape,” Landscape and Urban Planning 14 (1987): 379-98.
[102] The original use of the term “smart grid” remains difficult to determine, though it seems to have become widely used by the end of the 1990s. The terms “smart grid” and “smart meter” were used in the Ontario (Canada) Energy Board Act of 1998 (S.O. 1998, Chapter 15, Schedule B), at http://www.e-laws.gov.on.ca/html/statutes/english/elaws_statutes_98o15_e.htm. The legislation notes that the meaning of “smart grid” is the same as in the Ontario Electricity Act, 1998 (S.O. 1998, Chapter 15, Schedule A) at http://www.e-laws.gov.on.ca/html/statutes/english/elaws_statutes_98e15_e.htm, which defines the term as “the advanced information exchange systems and equipment.” Further elaboration in the law notes that “For the purposes of this Act, the smart grid means the advanced information exchange systems and equipment that when utilized together improve the flexibility, security, reliability, efficiency and safety of the integrated power system and distribution systems, particularly for the purposes of,(a) enabling the increased use of renewable energy sources and technology, including generation facilities connected to the distribution system; (b) expanding opportunities to provide demand response, price information and load control to electricity customers; (c) accommodating the use of emerging, innovative and energy-saving technologies and system control applications…” (Section 1.3 of Ontario Electricity Act, 1998).
[103] Steve Silberman, “The Energy Web,” Wired 9 (July 2001) at http://www.wired.com/wired/archive/9.07/juice.html, accessed 16 December 2010.
[104] Some utilities have employed direct control over some appliances, such as air conditioners during peak periods, for decades. For details on the approach used by Long Island Lighting Company, see “Sarah Lyall, “A Few Stay Hot on Long Island So More Can Stay Cool,” New York Times, 2 June 1989, from Factiva.
[105] The American Recovery and Reinvestment Act (ARRA) of 2009 (Public Law 111-5, signed 17 February 2009) contained $4.5 billion for smart-grid and related projects along with several billions more for energy-efficiency efforts. ARRA, Division A, Title IV, “Department of Energy, Energy Programs, Electricity Delivery and Energy Reliability,” and “Smart Grid Stimulus money comes in many forms,” Smartgridnews.com, 24 February 2009 at http://www.smartgridnews.com/artman/publish/news/Smart_Grid_Stimulus_money_comes_in_many_forms_Money_to_flow_by_April_Smart_Grid_a_better_2009_investment_than_alternative_energy.html.
[106] Baltimore Gas and Electric, “Baltimore Gas and Electric Company Unveils Plans for One of the Most Advanced Smart Grid Initiatives in the Nation,” news release at http://ir.constellation.com/releasedetail.cfm?ReleaseID=395941, accessed 1 October 2013.
[107] Rebecca Smith, “Regulators; What Utilities Have Learned From Smart-Meter Tests… …And why they aren’t putting those lessons to use ” Wall Street Journal, 22 February 2010, from Factiva; and Connecticut Light and Power, “Results of CL&P Plan-It Wise Energy Pilot,” Connecticutt Department of Public Utility Control document DPU 09-34, at http://www.env.state.ma.us/dpu/docs/electric/09-34/21210wmrspag1a4.pdf, accessed 1 October 2013.
[108] “GE’s Smart Grid Kitchen of the Future,” cnet news, 16 July 2009, at http://news.cnet.com/2300-11128_3-10001207.html?tag=mncol, accessed 4 March 2010.
[109] For information on Excel Energy’s SmartGridCity program, see Xcel Energy, “Xcel Energy Smart Grid: A White Paper,” Doc. 08-01-311, February 2008, http://smartgridcity.xcelenergy.com/media/pdf/SmartGridWhitePaper.pdf, accessed 8 March 2010; Heath Urie, ” Xcel starts ‘smart grid’ program in Boulder ” Boulder (CO) Daily Camera, 15 May 2008 2008., Xcel Energy, “Xcel Energy announces first Smart Grid City in the nation; Boulder, Colo., to be fully integrated smart electricity city,” “http://www.xcelenergy.com/Colorado/Company/Newsroom/News%20Releases/Pages/Xcel_Energy_announces_first_Smart_Grid_City_in_the_nation.aspx, accessed 8 March 2010.
[110] See http://smartgridcity.xcelenergy.com/.
[111] In 2009, Excel announced that the costs of the program had increased beyond projections, causing it to ask for a rate hike to pay for it (and other facilities). Laura Snider, “Xcel Smart Grid Costs Blow Up, PUC Orders More Transparency,” Daily Camera (Boulder, CO), 6 February 2010, from Factiva. For examples of successes and concerns about the smart grid, see Julie Schmit, “Consumers watch their bills as utilities get smart ; Transition to smart grid has a lot of promise, but potholes, too ” USA Today, 17 February 2010, B1. California’s prominent consumer advocate, TURN (The Utility Reform Network) continues to fight efforts to pass along the cost of smart meters to consumers. See TURN “Smart Meters: A Dumb Idea,” at http://www.turn.org/issues/smart-meters/sm-dumb-idea.html, accessed 9 August 2010.
[112] In a striking setback for smart-grid advocates, Maryland’s Public Service Commission at first rejected Baltimore Gas and Electric’s plan to deploy smart grid technologies and associated dynamic (real-time priced) electricity rate structures, which might have caused some customers’ costs to increase dramatically. But in August 2010, the commission approved a modified plan that limited the utility from recovering the costs of the smart meter system in advance of completion of the system; rather, the costs would be recovered from customers in regular hearings addressing overall cost of service and rates. Peter Behr, “Md.’s Veto of Advanced Meter Deployment Stuns Smart Grid Advocates,” New York Times online, 23 June 2010, accessed 15 August 2010. Hanah Cho correct spelling, “BGE to Move Ahead with ‘Smart Grid’ Plan,” Baltimore Sun (17 August 2010), from Factiva; and Public Service Commission of Maryland, “In the Matter of the Application of Baltimore Gas and Electric Company for Authorization to Deploy a Smart Grid Initiative and to Establish a Surcharge for the Recovery of Cost,” Order No. 83531, Case No. 9208, 12 August 2010. Beyond simply paying extra for the costs of the new equipment, some customers object because they fail to understand how smart meters, and the variable pricing mechanisms they depend on, can cause their bills to rise. Tom McNichol, “Race Against the Machine. Smart meters will tell us more about our energy use, unless consumers mutiny first,” Time (10 January 2011), 62.
[113] See Steven E. Letendre and Willett Kempton, “The V2G Concept: A New Model for Power?” Public Utilities Fortnightly (February 15, 2002), 16-26; Willett Kempton Willett and Jasna Tomic, “Vehicle-to-grid Power Fundamentals: Calculating Capacity and Net Revenue,” Journal of Power Sources 144 (2005): 268-79; and Henrik Lund and Willett Kempton, “Integration of Renewable Energy Into the Transport and Electricity Sectors Through V2G.” Energy Policy 36 (2008): 3578-87.
[114] Wellinghoff described ancillary services in testimony to the Senate Committee on Energy and Natural Resources, “Grid-Scale Energy Storage,” 111th Congress, S. Hearning 111-335, 10 December 2009, 13-18. For other discussions of ancillary services, see page 2.7 of U.S. Department of Energy, “The Smart Gird: An Estimation of the Energy and CO2 Benefits,” PNNL-19112, revision 1, at http://energyenvironment.pnl.gov/news/pdf/PNNL-19112_Revision_1_Final.pdf, accessed 5 June 2010.
[115] Pacific Northwest National Laboratory, “Department of Energy Putting Power in the Hands of Consumers Through Technology,” http://www.pnl.gov/topstory.asp?id=285, accessed 10 March 2010.
[116] Testimony by Kenneth Huber, PJM Interconnection, in Senate, “Grid-Scale Energy Storage,” 42-49.
[117] John Wellinghoff, “CashBack Cars,” in David Sandalow, ed., Plug-in Electric Vehicles: What Role for Washington? (Washington, D.C.: Brookings Institution Press, 2009), 65-85. Also, interview of Jon Wellinghoff by Richard Hirsh, 27 February 2010. See graphs in Wellinghoff’s presentations, such as at the “Smart Grid Road Show, Portland, OR, 3 November 2010, with slides at http://www.ferc.gov/EventCalendar/Files/20101103151230-SmartGridRoadshow-11-3-2010.pdf, accessed 10 January 2011.
[118] Google has begun partnering with utilities to offer an online energy monitoring tool called “Powermeter.” http://www.google.com/powermeter/about, accessed 6 January 2011. Microsoft began home energy monitoring hardware and software through Microsoft Hohm. http://www.microsoft-hohm.com/, accessed 6 January 2011, but it discontinued the service in 2012. Brad Sams, “Microsoft Hohm discontinued,”Neowin.net, 30 June 2011, at http://www.neowin.net/news/microsoft-hohm-service-discontinued, accessed 1 October 2013. .
[119] Google Energy LLC, a subsidiary of Google, applied to FERC to enter the wholesale market. See “Application of Google Energy LLC For Market Based Rate Authority and Granting of Waivers and Blanket Authorizations,” FERC Docket ER10-468-000, filed at FERC 23 December 2009. See other submissions and FERC decisions by searching at http://elibrary.ferc.gov.
[120] One energy blogger, “GreenMonk,” asked, is “Google Energy to start disrupting the utility industry?” http://greenmonk.net/google-energy-to-start-disrupting-the-utility-industry/, accessed 10 January 2011.
[121] For example, President Obama announced the government’s support of loan guarantees to help utilities build nuclear power plants. Henry J. Pulizzi and Christine Buurma, “Obama Unveils Loan Guarantees for Nuclear Plant,” 16 February 2010, from wsj.com. Of course, R&D on small-scale nuclear plants, such as 45-MW modular plants being designed by NuScale (http://www.nuscalepower.com) may change the way managers, regulators, and the public view nuclear power.
[122] In a recorded phone call made during the California electricity crisis of 2000-2001 and made public in 2004, one Enron employee laughed about “all the money you guys [other Enron traders] stole from those poor grandmothers in California.” Joel Roberts, “Enron Traders Caught on Tape: Tapes Accessed by CBS Confirm Enron Played Role in Western Power Crisis,” CBS News, 1 June 2004, CBSnews.com, accessed 5 January 2011; and Kristen Hays, “Transcripts: Enron Traders Joked About Manipulating Calif Power,” Associate Press, 2 June 2004, from Factiva, 5 January 2011.
[123] Public Law 107-204, 116 Stat. 745, Sarbanes-Oxley Act to “protect investors by improving the accuracy and reliability of corporate disclosures made pursuant to the securities laws…,” enacted 30 July 2002.
[124] CNBC reported that Lehman Brothers’ assets totaled $639 billion at the end of May 2008. “Lehman Brothers Files for Bankruptcy, Scrambles to Sell Key Business,” at http://www.cnbc.com/id/26708143/Lehman_Brothers
_Files_For_Bankruptcy_Scrambles_to_Sell_Key_Business. CNN listed the asset total as $691 billion. “The 10 Largest U.S. Bankruptcies,” at http://money.cnn.com/galleries/2009/fortune/0905/gallery.largest_bankruptcies.fortune/index.html.
[125] CNBC, “Biggest Chapter 11 Cases,” at http://www.cnbc.com/id/26720522?slide=5. The ultimate taxpayer cost of the bailout fell dramatically when the government sold a large stake of its ownership of GM in November 2010. Michael J. de la Merced and Bill Vlasic, “U.S. Recovers Billions in Sale of G.M. Stock,” New York Times, 18 November 2010, r1, from Factiva.
[126] The tension between too much government regulation and too much laissez-faire is explored in David Wessel, “Keep Regulators Flexible, Current,” Wall Street Journal, 3 June 2010, A2. Though having nothing to do with the utility system, the oil spill in the Gulf of Mexico beginning in April 2010 reinforced the cynicism directed at both private industry and government oversight. On one hand, British Petroleum, the owner of the exploding oil rig, enjoyed too much latitude to do as it wished, and its unwise decisions left eleven dead and created the largest environmental disaster to date. On the other hand, during a period when “populist right” movements (exemplified by the Tea Party) gained appeal for attacking government’s intrusion into too many affairs, the government endured criticism for not sufficiently regulating the giant oil company and for permitting the firm to make unchecked decisions that had potentially extraordinary consequences. The irony of the conservative and liberal rhetoric that followed the oil spill is described in Thomas Frank, “Laissez-Faire Meets the Oil Spill,” Wall Street Journal, 2 June 2010, A19. Similar disappointment in both business practice and regulatory oversight existed in the aftermath of the coal mine accident that killed 29 workers in 2010. See Kris Maher, “Mine Probe Faults Massey; Comprehensive Study Cites Poor Ventilation, Coal-Dust Buildup, Lax Regulators,” Wall Street Journal, 20 May 2011, A3.
[127] In Virginia, rates for some residential consumers increased more than 70 percent between July 2007—soon after the state legislature ended the deregulation experiment—and December 2009, creating a backlash that caught politicians by surprise. Data for 2007 and 2009 from Jeff Sturgeon, “Appalachian Resumes Push for Higher Rates,” Roanoke Times, 14 July 2007, C8, from Factiva, and Duncan Adams, “Appalachian’s Rate Increases are on Horizon,” Roanoke Times, 11 December 2009, A13, from Factiva. The political response to the rates is discussed in Michael Sluss, “McDonnell Signs Measures to Alleviate Utility Costs,” Roanoke Times, 23 February 2010, A12, from Factiva.